Some correlations are noise.
Some are structural.
The relationship between energy and long duration bonds falls into the second category.
For decades, when you zoom out, energy and Treasury bonds have tended to move in opposite directions. Not every week. Not every quarter. But over full cycles — the correlation is sturdy.
Why?
Because bonds are priced on two primary forces: growth and inflation.
Long duration Treasuries, like $TLT, reflect what the market believes about the path of economic growth and long-term inflation. If growth is accelerating and inflation pressures are building, yields rise. And when yields rise, bond prices fall.
Energy — especially oil — sits at the center of that equation.
Oil is not just another commodity. It's embedded in transportation, industrial production, agriculture, plastics, chemicals — nearly every part of the global supply chain. When oil trends higher in a sustained way, it often signals firm demand, tightening supply, or both. That tends to feed into inflation expectations. And inflation expectations are kryptonite for long duration bonds.
Now — are there periods where energy and bonds rally together?
Absolutely.
Liquidity injections.
Short covering squeezes.
Recession scares.
Positioning extremes.
You can get temporary windows where both run in the same direction. But those periods rarely define the primary trend. Eventually, growth and inflation realities reassert themselves. And historically, that durable correlation emerges.
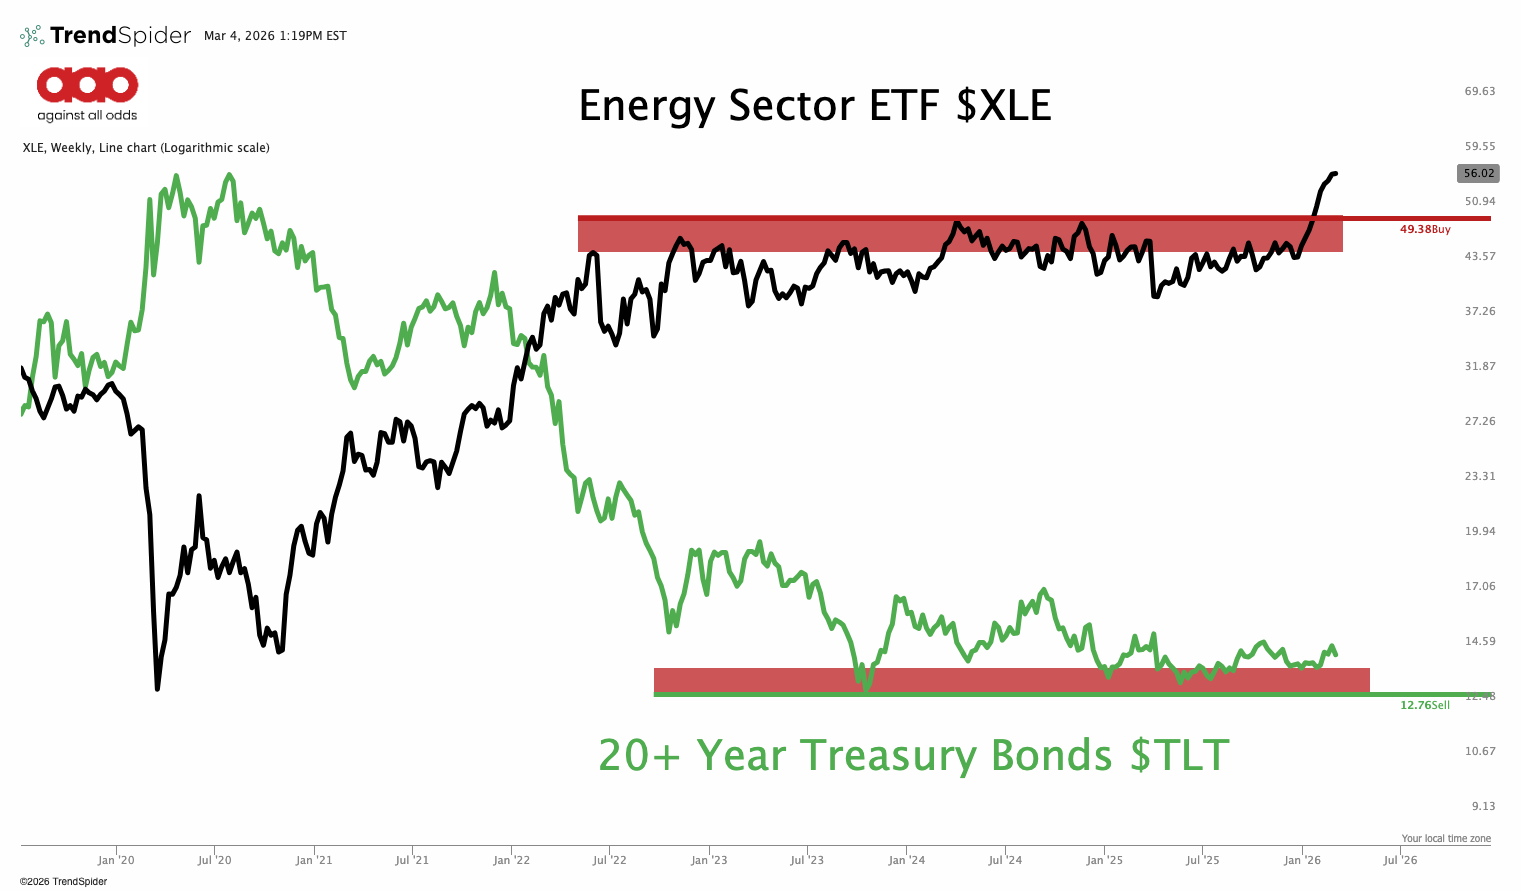
Now take a look at the chart. |
Focus on what's happening structurally.
On the top panel, Energy ($XLE) is breaking through a multi year resistance zone. It's resolving higher out of compression. That's not defensive positioning. That's inflationary behavior.
On the bottom panel, 20+ Year Treasuries ($TLT) are pinned near support. The rallies are failing. Momentum is muted. It looks heavy.
If energy continues to hold above that breakout zone…
If oil continues to rip…
If the commodity complex stays firm…
It becomes increasingly difficult to argue that long duration bonds should be making a sustained move higher.
Do I know exactly when $TLT rolls over again?
No.
Timing is secondary here.
What matters is the pressure building inside this relationship.
Either energy rolls over hard and inflation expectations cool — giving bonds room to rally.
Or energy keeps grinding higher — and yields are forced upward, pushing $TLT lower.
My bet, based on durable correlations, is that this comes to a head.
And if energy continues to lead, history suggests bonds will eventually respond.
Energy and long-duration bonds can coexist peacefully for short bursts.
But over time?
Growth and inflation win.
And right now, energy is speaking loudly. |
The last time the CBOE made a structural change like this, the traders who caught it early had an edge that lasted years. Steve Strazza is breaking down the January 2026 update live on Today at 4 PM ET — and it's completely free to attend. Register here |
|
| Jason Perz | ASC Gold Rush | Save The Bees |
|
|
All Star Charts emails are a financial publication of general circulation and only offers impersonal advice, not tailored to individual needs of a specific client or group. Any comments or statements made herein do not necessarily reflect those of All Star Charts or its affiliates (collectively, "All Star Charts") and do not constitute buy or sell recommendations. Unless specifically indicated, this message is not an official confirmation of any transaction. The contents of any email communications to or from All Star Charts may be monitored or reviewed at All Star Charts's discretion. All Star Charts accepts no responsibility for any loss or damage arising in any way from the use of this transmission and any attachments; it is the responsibility of the recipient to ensure that they are virus free. If you reply to this email, please note that we are a public investor and do not want any material non-public information. We do not agree to keep confidential any information you provide and do not agree to any restrictions on our trading activity, except pursuant to a written confidentiality agreement executed by All Star Charts. |
Want to change how you receive these emails? You can manage your preferences here unsubscribe.
© 2026 All Star Charts 624 Broadway, Suite 405 San Diego, CA 92101
|
|
|
|