It’s one of the largest holdings in the ETF and a direct way to express this theme.
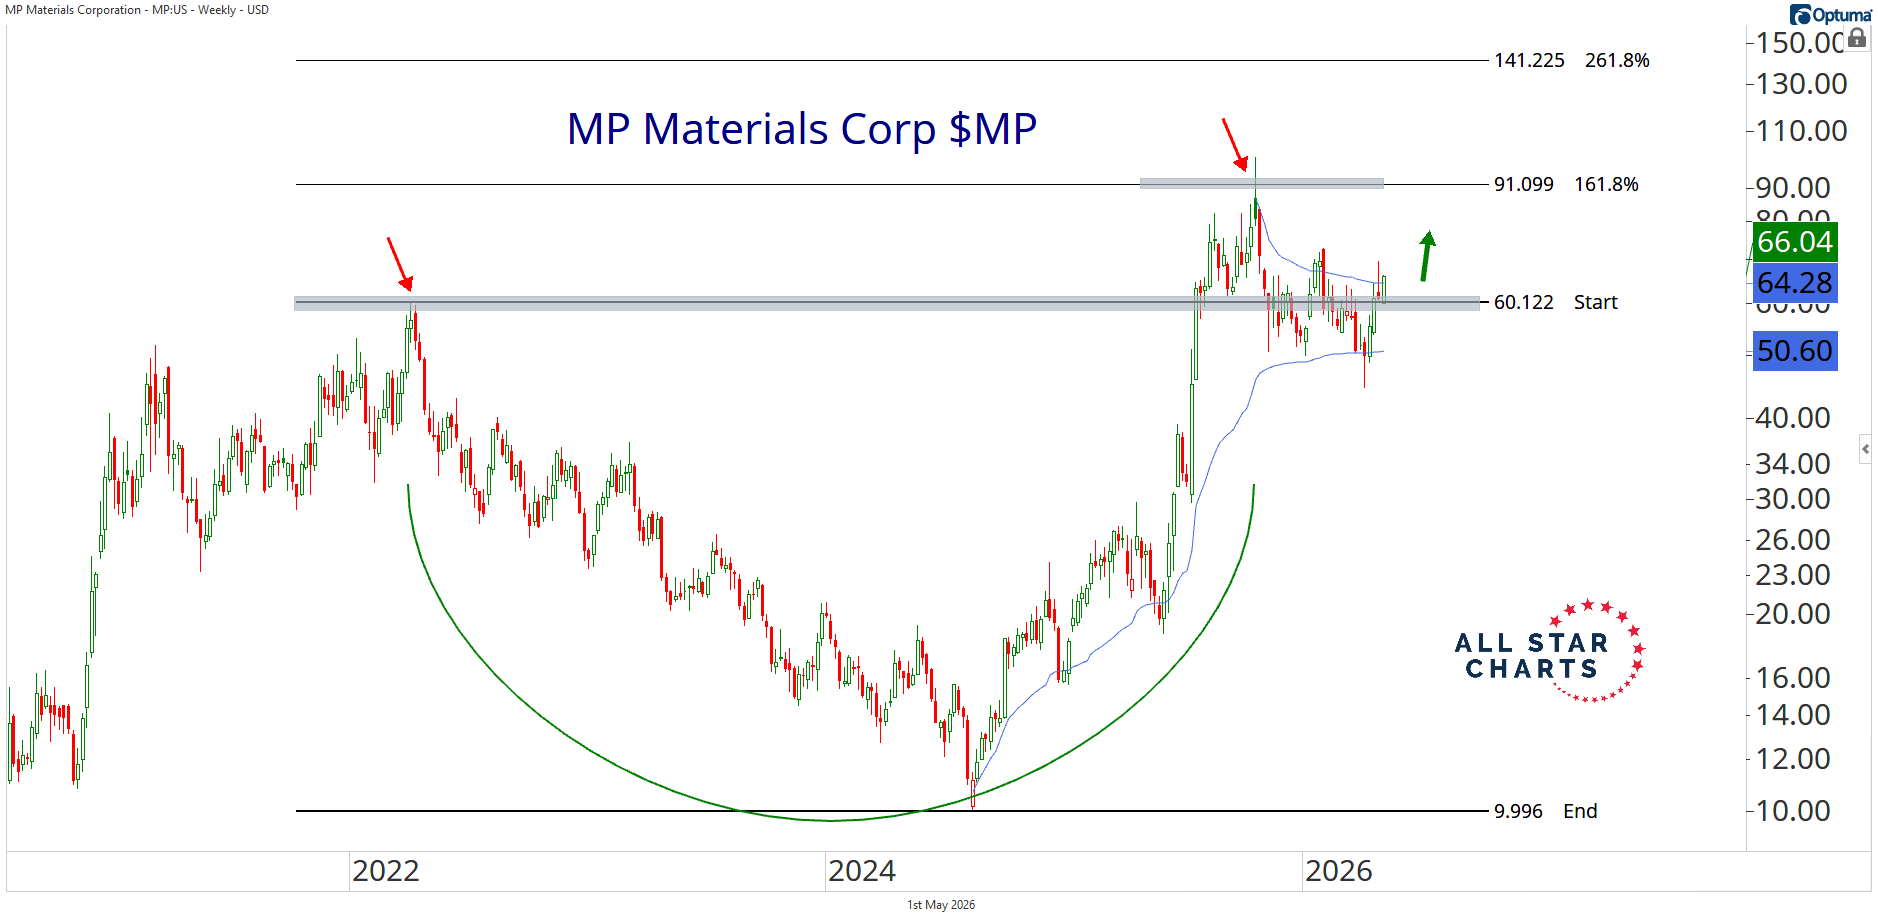
Right now, the stock is coiling just around former cycle highs, compressing between VWAPs anchored to its all-time lows and highs — what we call a pinch pattern.
This setup reflects a market where both long-term buyers and sellers are converging at the same level, tightening price action. When that tension builds, it often resolves with a sharp, directional move.
That’s why it’s one of my favorite patterns — you’re positioning ahead of expansion.
On top of that, MP carries about 18% short interest.
That simply means a meaningful portion of the float is betting against the stock. And if price starts moving higher, those shorts can get squeezed — forced to buy back shares to cover, which only adds fuel to the upside.
That’s what makes this setup even more interesting.
As long as we’re above 60, I like MP long with a target of 90.
Yesterday I bought common stock and added calls through Breakout Multiplier.
If you want the full trade details and real-time ideas as they develop, you can join us risk-free.
Stay sharp 😉
Alfonso De Pablos, CMT
Director of Research, All Star Charts