Wednesday, March 25, 2026
|
|
|
Over the past two years, the story in commodities has been pretty straightforward.
Precious metals have been the clear leaders.
Ever since Gold broke out on March 4, 2024, the entire complex has been dominated by strength in Gold, Silver, and the mining stocks.
It has been one of the cleanest and most persistent trends we've seen across any asset class, with capital consistently flowing into the metals while much of the rest of the commodity space lagged behind.
But markets don't stay static forever.
Instead, they evolve and rotate.
And when leadership begins to shift, it almost always shows up first in intermarket relationships rather than in headlines.
That's exactly what we're seeing right now.
There are two key ratios that illustrate just how quickly the environment is changing, and both send a very similar message.
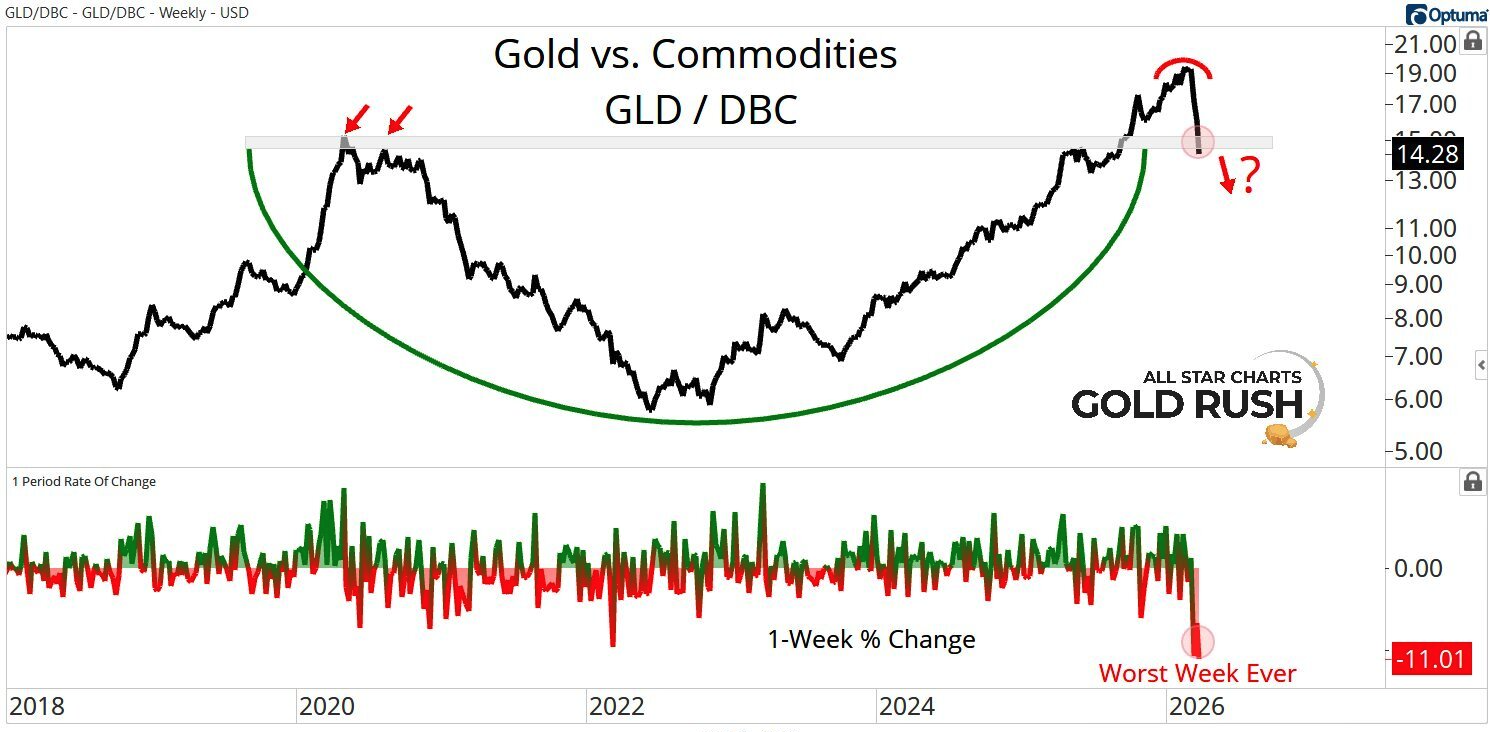
The first is Gold relative to the broader commodities complex, which we track using the ratio of the Gold ETF $GLD to the Commodities ETF $DBC.
|
Since bottoming in June of 2022, this ratio has been in a strong primary uptrend, with Gold outperforming the broader commodity basket by more than 200% over that period.
That kind of sustained relative strength doesn't happen by accident. It reflects a steady demand from the world's largest financial institutions.
But last week, something changed...
This ratio broke below its prior-cycle highs, dating back to the middle of 2020.
And it didn't just drift lower...
The ratio suffered its worst weekly decline ever, based on data going back to 2006.
That kind of move is not normal, and it's certainly not something we see in healthy, ongoing uptrends.
Instead, it tends to occur at moments where the market is undergoing a transition, particularly when a leadership group begins to lose its relative edge.
Importantly, this doesn't mean precious metals need to crash from here.
It doesn't mean Gold and Silver can't move higher in absolute terms.
What it does suggest, however, is that the period of dominant outperformance from precious metals relative to the broader commodity complex is likely behind us, at least for now. |
Steve Strazza closed out most of his energy positions this week and moved 85% of the Wave Trader portfolio into tech and large-cap growth — and yesterday he showed exactly why on live charts! The same volatility compression signal that called the energy trade in January is now showing up across the software sector. Replay is here. |
|
| Jason Perz | ASC Gold Rush | Save The Bees |
|
|
All Star Charts emails are a financial publication of general circulation and only offers impersonal advice, not tailored to individual needs of a specific client or group. Any comments or statements made herein do not necessarily reflect those of All Star Charts or its affiliates (collectively, "All Star Charts") and do not constitute buy or sell recommendations. Unless specifically indicated, this message is not an official confirmation of any transaction. The contents of any email communications to or from All Star Charts may be monitored or reviewed at All Star Charts's discretion. All Star Charts accepts no responsibility for any loss or damage arising in any way from the use of this transmission and any attachments; it is the responsibility of the recipient to ensure that they are virus free. If you reply to this email, please note that we are a public investor and do not want any material non-public information. We do not agree to keep confidential any information you provide and do not agree to any restrictions on our trading activity, except pursuant to a written confidentiality agreement executed by All Star Charts. |
Want to change how you receive these emails? You can manage your preferences here unsubscribe.
© 2026 All Star Charts 624 Broadway, Suite 405 San Diego, CA 92101
|
|
|
|