26 year highs with more to go? ͏ ͏ ͏ ͏ ͏ ͏ ͏ ͏ ͏ ͏ ͏ ͏ ͏ ͏ ͏ ͏ ͏ ͏ ͏ ͏ ͏ ͏ ͏ ͏ ͏ ͏ ͏ ͏ ͏ ͏ ͏ ͏ ͏ ͏ ͏ ͏ ͏ ͏ ͏ ͏ ͏ ͏ ͏ ͏ ͏ ͏ ͏ ͏ ͏ ͏ ͏ ͏ ͏ ͏ ͏ ͏ ͏ ͏ ͏ ͏ ͏ ͏ ͏ ͏ ͏ ͏ ͏ ͏ ͏ ͏ ͏ ͏ ͏ ͏ ͏ ͏ ͏ ͏ ͏ ͏ ͏ ͏ ͏ ͏ ͏ ͏ ͏ ͏ ͏ ͏ ͏ ͏ ͏ ͏ ͏ ͏ ͏ ͏ ͏ ͏ ͏ ͏ ͏ ͏ ͏ ͏ ͏ ͏ ͏ ͏ ͏ ͏ ͏ ͏ ͏ ͏ ͏ ͏ ͏ ͏ ͏ ͏ ͏ ͏ ͏ ͏ ͏ ͏ ͏ ͏ ͏ ͏ ͏ ͏ ͏ ͏ ͏ ͏ ͏ ͏ ͏ ͏ ͏ ͏ ͏ ͏ ͏ ͏ ͏ ͏ ͏ ͏ ͏ ͏ ͏ ͏ ͏ ͏ ͏ ͏ ͏ ͏ ͏ ͏ ͏ ͏ ͏ ͏ ͏ ͏
Wednesday, February 4, 2026 |
|
|
Do you want to know about the biggest moves before they occur? Click here and sign up for our new daily note, The Squeeze Watch, and get the tightest coil patterns delivered to your mailbox for free every day. |
|
|
Welcome to The Squeeze Watch. We're very excited to present our Squeeze Engine, one of the main tools that powers the success of Breakout Multiplier. Industrials remain one of the stronger corners of the market, as areas in tech and financials take massive hits. Here's today's standout: |
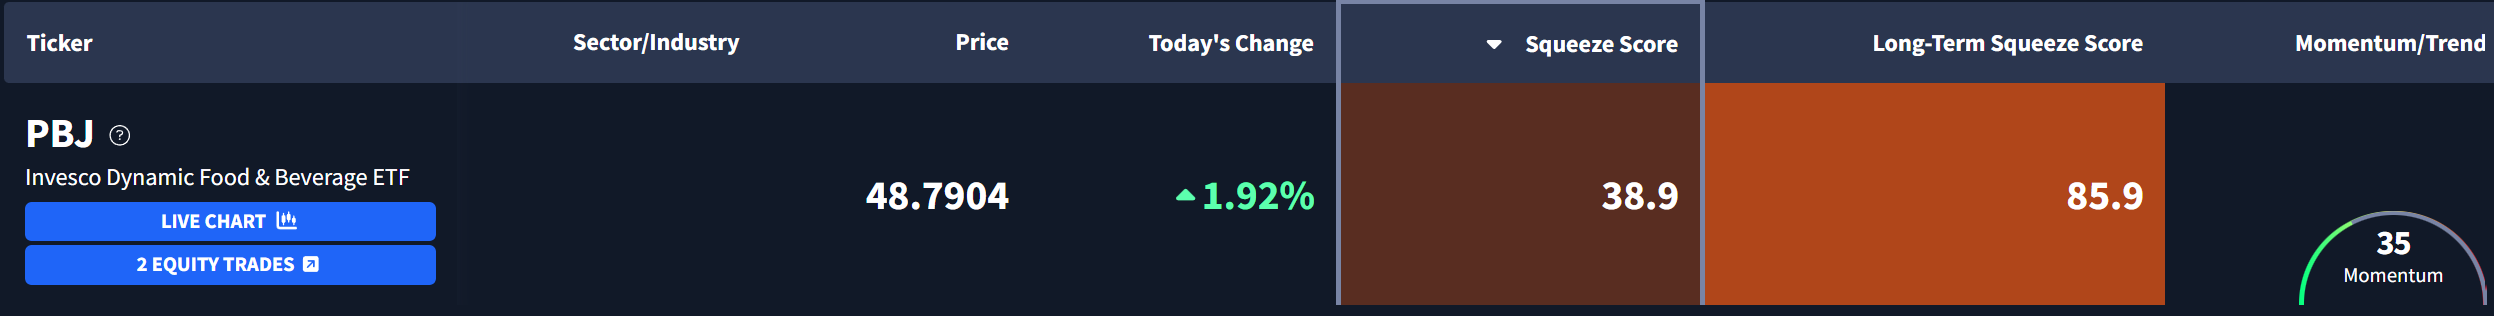
General Electric $GE is currently exhibiting a Long-Term Squeeze Score of 95.20. Here's what the chart looks like: |
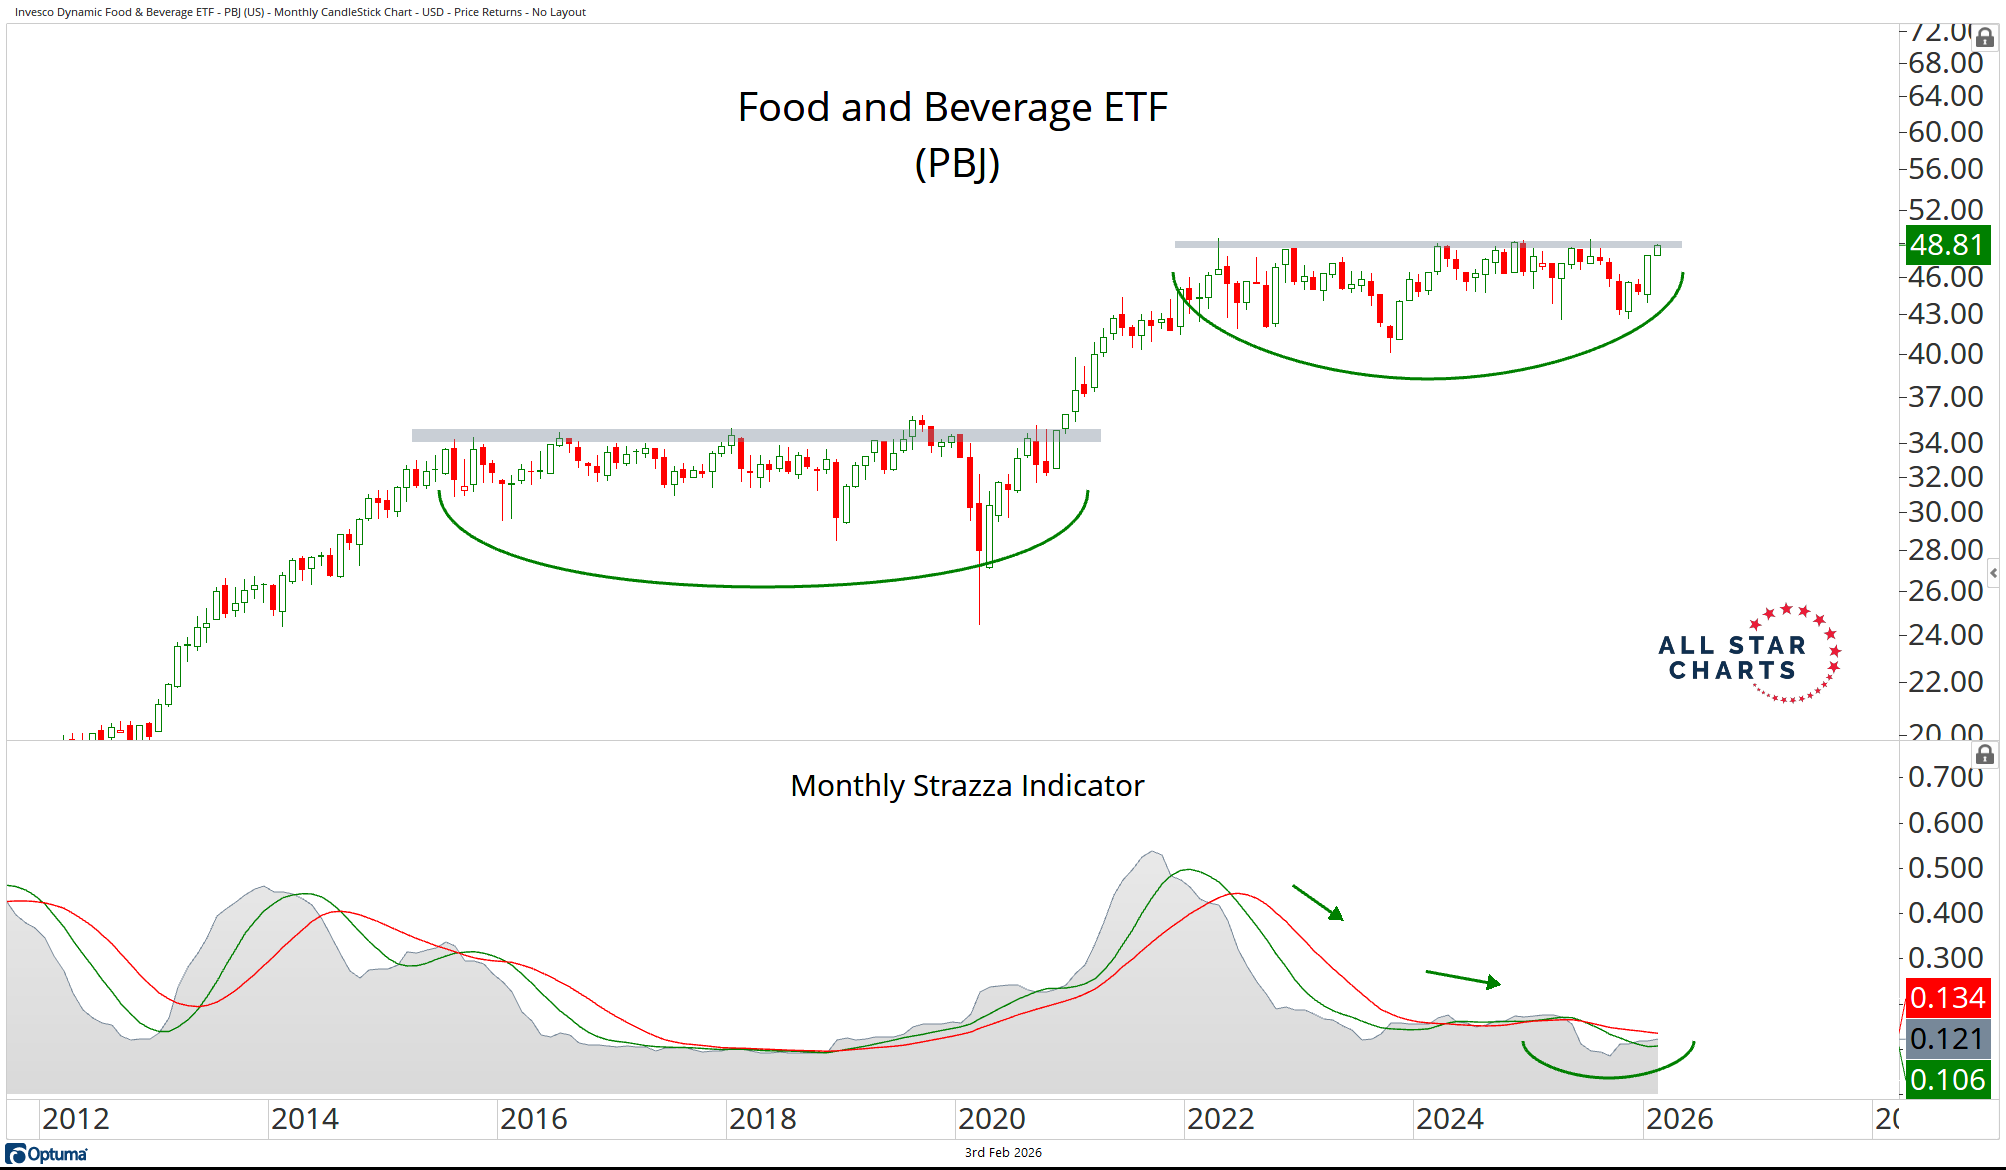
GE Aerospace, formerly General Electric, has delivered an epic five-year trend reversal. It went from a multi-cycle laggard to one of the market's strongest stocks for the first time in decades. Along the way, volatility has compressed several times, and each squeeze ultimately resolved higher. Now price is coiled in a tight range as the stock digests gains above its 2000 highs. Weekly Strazza Indicator volatility is setting up in a familiar way, echoing the three prior squeezes that preceded major upside resolutions. The best uptrends tend to correct through time, not price. These sideways coils are a feature of strength, not a flaw. Is there more juice in the tank for the General? If you want access to our Squeeze Engine and our next trade, join Breakout Multiplier here, risk-free. |
Steve Strazza | Chief Market Strategist, All Star Charts |
|
|
All Star Charts emails are a financial publication of general circulation and only offers impersonal advice, not tailored to individual needs of a specific client or group. Any comments or statements made herein do not necessarily reflect those of All Star Charts or its affiliates (collectively, "All Star Charts") and do not constitute buy or sell recommendations. Unless specifically indicated, this message is not an official confirmation of any transaction. The contents of any email communications to or from All Star Charts may be monitored or reviewed at All Star Charts's discretion. All Star Charts accepts no responsibility for any loss or damage arising in any way from the use of this transmission and any attachments; it is the responsibility of the recipient to ensure that they are virus free. If you reply to this email, please note that we are a public investor and do not want any material non-public information. We do not agree to keep confidential any information you provide and do not agree to any restrictions on our trading activity, except pursuant to a written confidentiality agreement executed by All Star Charts. |
Want to change how you receive these emails? You can manage your preferences here unsubscribe.
© 2026 All Star Charts 624 Broadway, Suite 405 San Diego, CA 92101
|
|
|
|