This biotech ETF is is coiled up and ready to break ͏ ͏ ͏ ͏ ͏ ͏ ͏ ͏ ͏ ͏ ͏ ͏ ͏ ͏ ͏ ͏ ͏ ͏ ͏ ͏ ͏ ͏ ͏ ͏ ͏ ͏ ͏ ͏ ͏ ͏ ͏ ͏ ͏ ͏ ͏ ͏ ͏ ͏ ͏ ͏ ͏ ͏ ͏ ͏ ͏ ͏ ͏ ͏ ͏ ͏ ͏ ͏ ͏ ͏ ͏ ͏ ͏ ͏ ͏ ͏ ͏ ͏ ͏ ͏ ͏ ͏ ͏ ͏ ͏ ͏ ͏ ͏ ͏ ͏ ͏ ͏ ͏ ͏ ͏ ͏ ͏ ͏ ͏ ͏ ͏ ͏ ͏ ͏ ͏ ͏ ͏ ͏ ͏ ͏ ͏ ͏ ͏ ͏ ͏ ͏ ͏ ͏ ͏ ͏ ͏ ͏ ͏ ͏ ͏ ͏ ͏ ͏ ͏ ͏ ͏ ͏ ͏ ͏ ͏ ͏ ͏ ͏ ͏ ͏ ͏ ͏ ͏ ͏ ͏ ͏ ͏ ͏ ͏ ͏ ͏ ͏ ͏ ͏ ͏ ͏ ͏ ͏ ͏ ͏ ͏ ͏ ͏ ͏ ͏
Thursday, February 26, 2026 |
|
|
Do you want to know about the biggest moves before they occur? Click here and sign up for our new daily note, The Squeeze Watch, and get the tightest coil patterns delivered to your mailbox for free every day. |
|
|
Welcome to The Squeeze Watch. We're very excited to present our Squeeze Engine, one of the main tools that powers the success of Breakout Multiplier. Biotechs began reversing trend in a meaningful way last year and have remained a pocket of strength ever since. After the initial surge, they have spent the past three months consolidating and coiling, storing energy for the next move. Here's today's standout: |
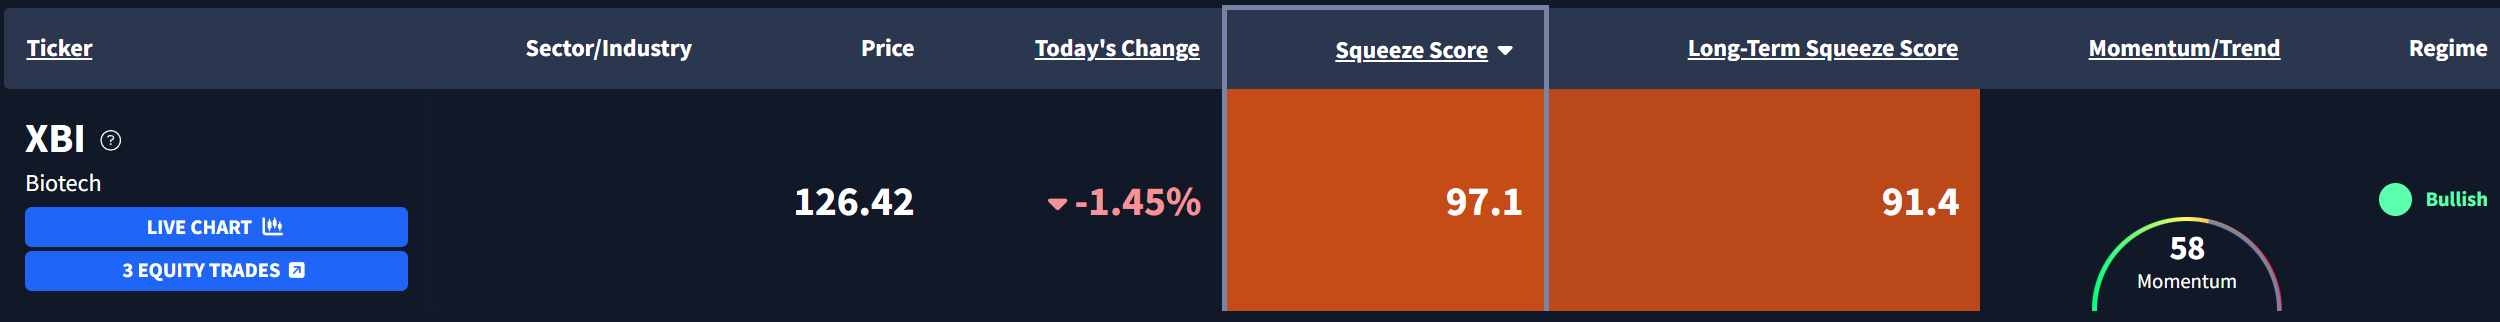
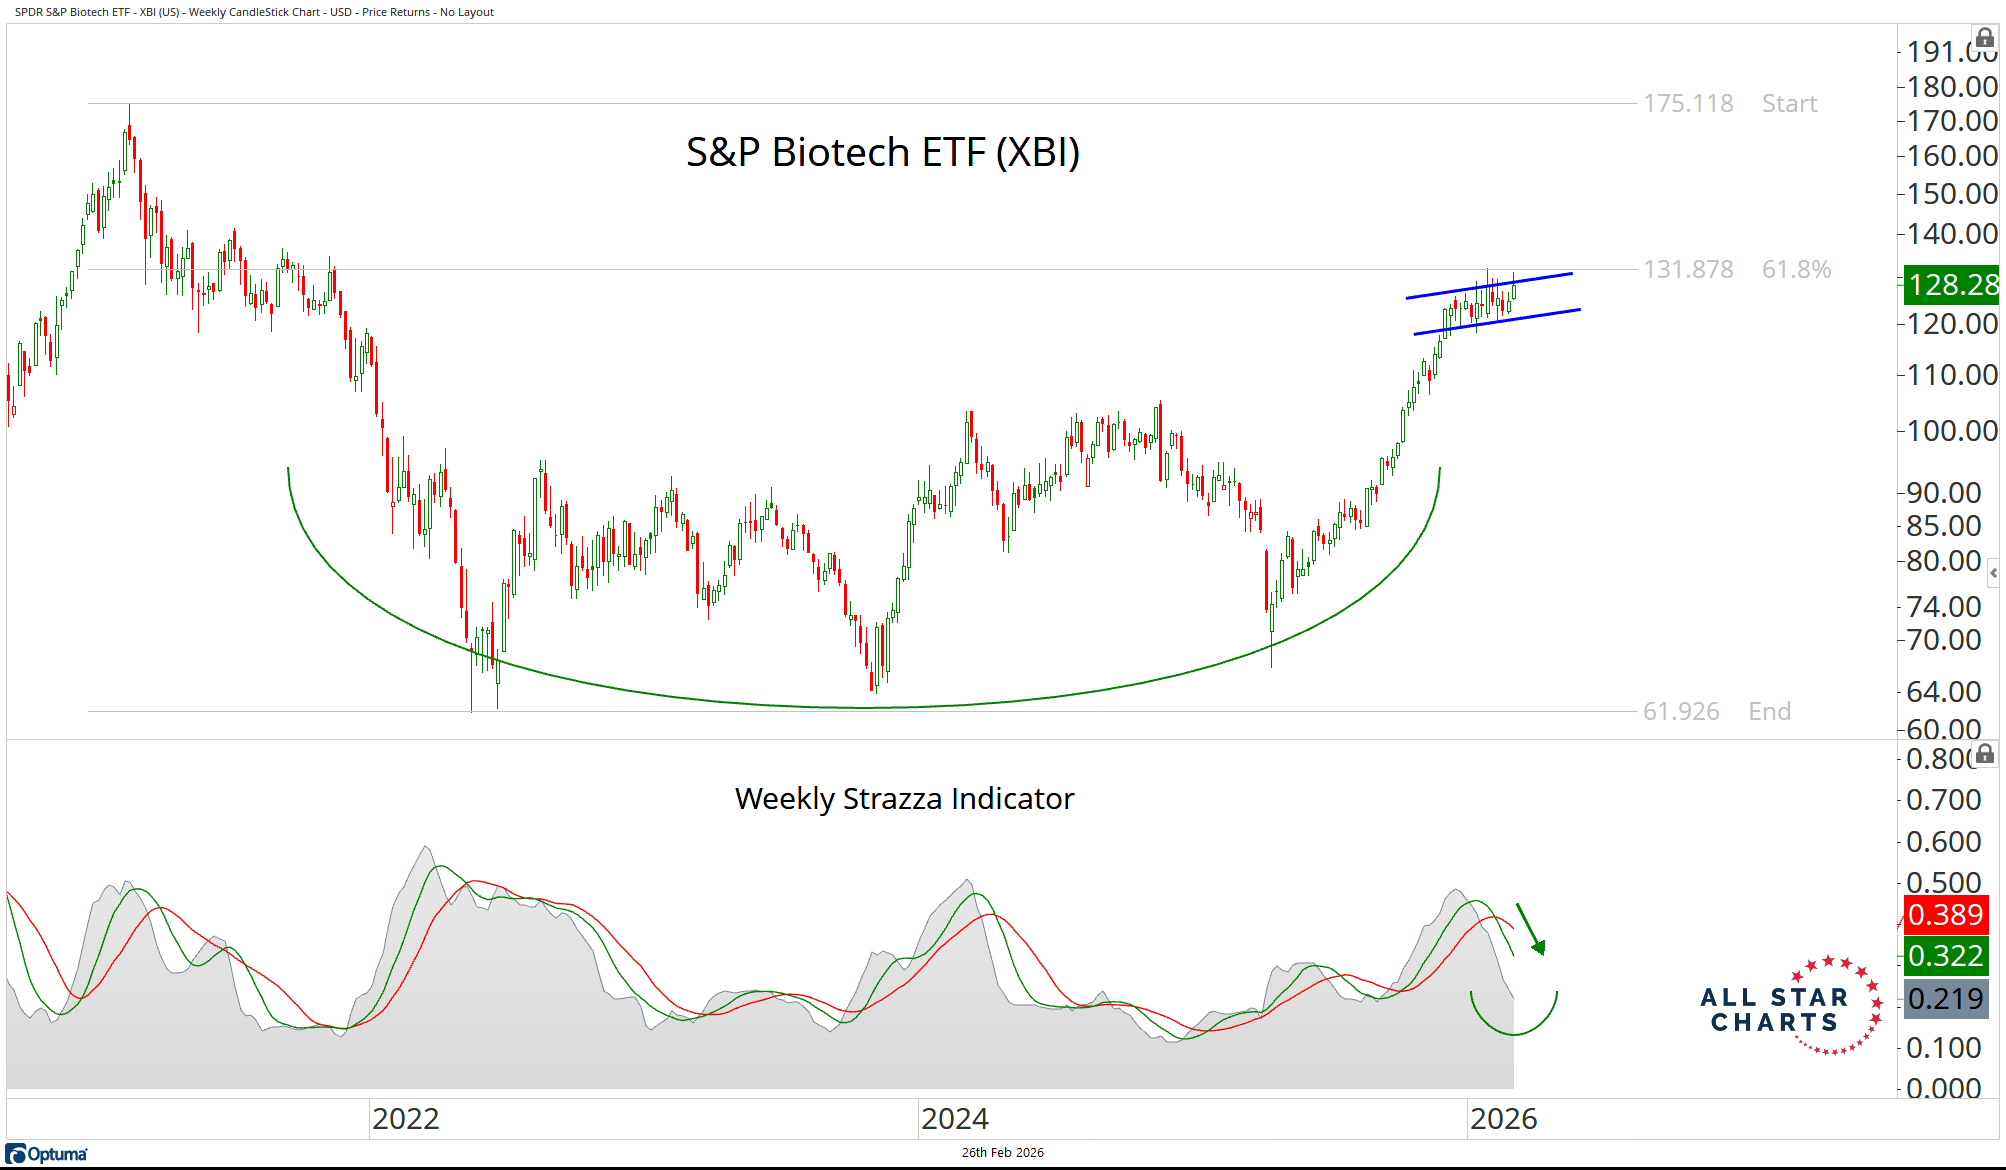
The S&P Biotech ETF $XBI is currently exhibiting a Squeeze Score of 97.1 and an even tighter Long-Term Squeeze Score of 91.4. Here's what the chart looks like: |
Biotechs have been coiling in a tight, multi-month range within the context of a bearish-to-bullish structural trend reversal. Volatility on the weekly Strazza Indicator continues to compress as price sits just beneath the 61.8 percent Fibonacci retracement. A breakout above 131 would signal the consolidation phase is complete and the next leg higher is underway. Biotech remains a relatively illiquid corner of the market, so expressing the theme through the index, using $XBI, is often the cleaner and safer approach. If you want access to our Squeeze Engine and our next trade, join Breakout Multiplier here, risk-free. |
Steve Strazza | Chief Market Strategist, All Star Charts |
|
|
All Star Charts emails are a financial publication of general circulation and only offers impersonal advice, not tailored to individual needs of a specific client or group. Any comments or statements made herein do not necessarily reflect those of All Star Charts or its affiliates (collectively, "All Star Charts") and do not constitute buy or sell recommendations. Unless specifically indicated, this message is not an official confirmation of any transaction. The contents of any email communications to or from All Star Charts may be monitored or reviewed at All Star Charts's discretion. All Star Charts accepts no responsibility for any loss or damage arising in any way from the use of this transmission and any attachments; it is the responsibility of the recipient to ensure that they are virus free. If you reply to this email, please note that we are a public investor and do not want any material non-public information. We do not agree to keep confidential any information you provide and do not agree to any restrictions on our trading activity, except pursuant to a written confidentiality agreement executed by All Star Charts. |
Want to change how you receive these emails? You can manage your preferences here unsubscribe.
© 2026 All Star Charts 624 Broadway, Suite 405 San Diego, CA 92101
|
|
|
|