Growth has dominated for years… but the market may be signaling a shift. ͏ ͏ ͏ ͏ ͏ ͏ ͏ ͏ ͏ ͏ ͏ ͏ ͏ ͏ ͏ ͏ ͏ ͏ ͏ ͏ ͏ ͏ ͏ ͏ ͏ ͏ ͏ ͏ ͏ ͏ ͏ ͏ ͏ ͏ ͏ ͏ ͏ ͏ ͏ ͏ ͏ ͏ ͏ ͏ ͏ ͏ ͏ ͏ ͏ ͏ ͏ ͏ ͏ ͏ ͏ ͏ ͏ ͏ ͏ ͏ ͏ ͏ ͏ ͏ ͏ ͏ ͏ ͏ ͏ ͏ ͏ ͏ ͏ ͏ ͏ ͏ ͏ ͏ ͏ ͏ ͏ ͏ ͏ ͏ ͏ ͏ ͏ ͏ ͏ ͏ ͏ ͏ ͏ ͏ ͏ ͏ ͏ ͏ ͏ ͏ ͏ ͏ ͏ ͏ ͏ ͏ ͏ ͏ ͏ ͏ ͏ ͏ ͏ ͏ ͏ ͏ ͏ ͏ ͏ ͏ ͏ ͏ ͏ ͏ ͏ ͏
Thursday, January 15, 2026 |
|
|
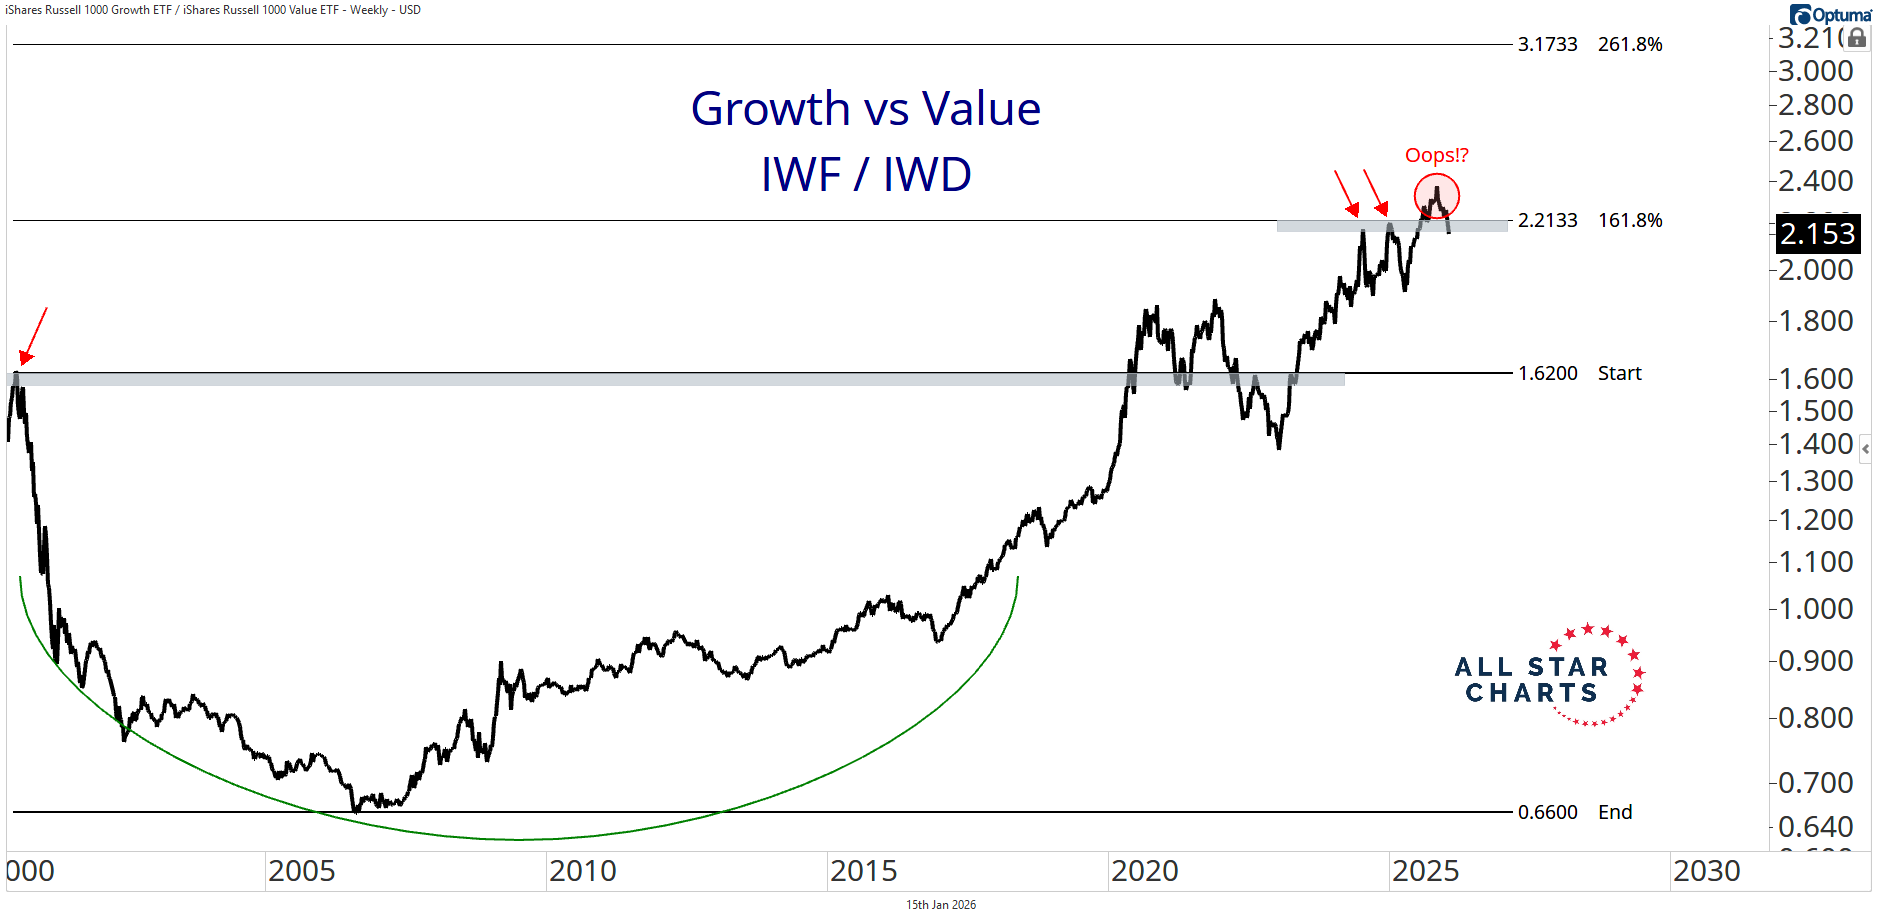
A Decade of Growth… About to Pause? For nearly twenty years, the market played by a simple set of rules: Growth over value. This trend guided portfolios and dominated positioning for more than a decade. But now the question is rising: could that be changing? Could we be entering a phase where money rotates back into more value-oriented areas of the market? Less tech, and more Financials, Industrials, Materials, and even Energy? A logical place to start watching for a potential rotation is the Russell 1000 Growth $IWF versus the Russell 1000 Value $IWD. |
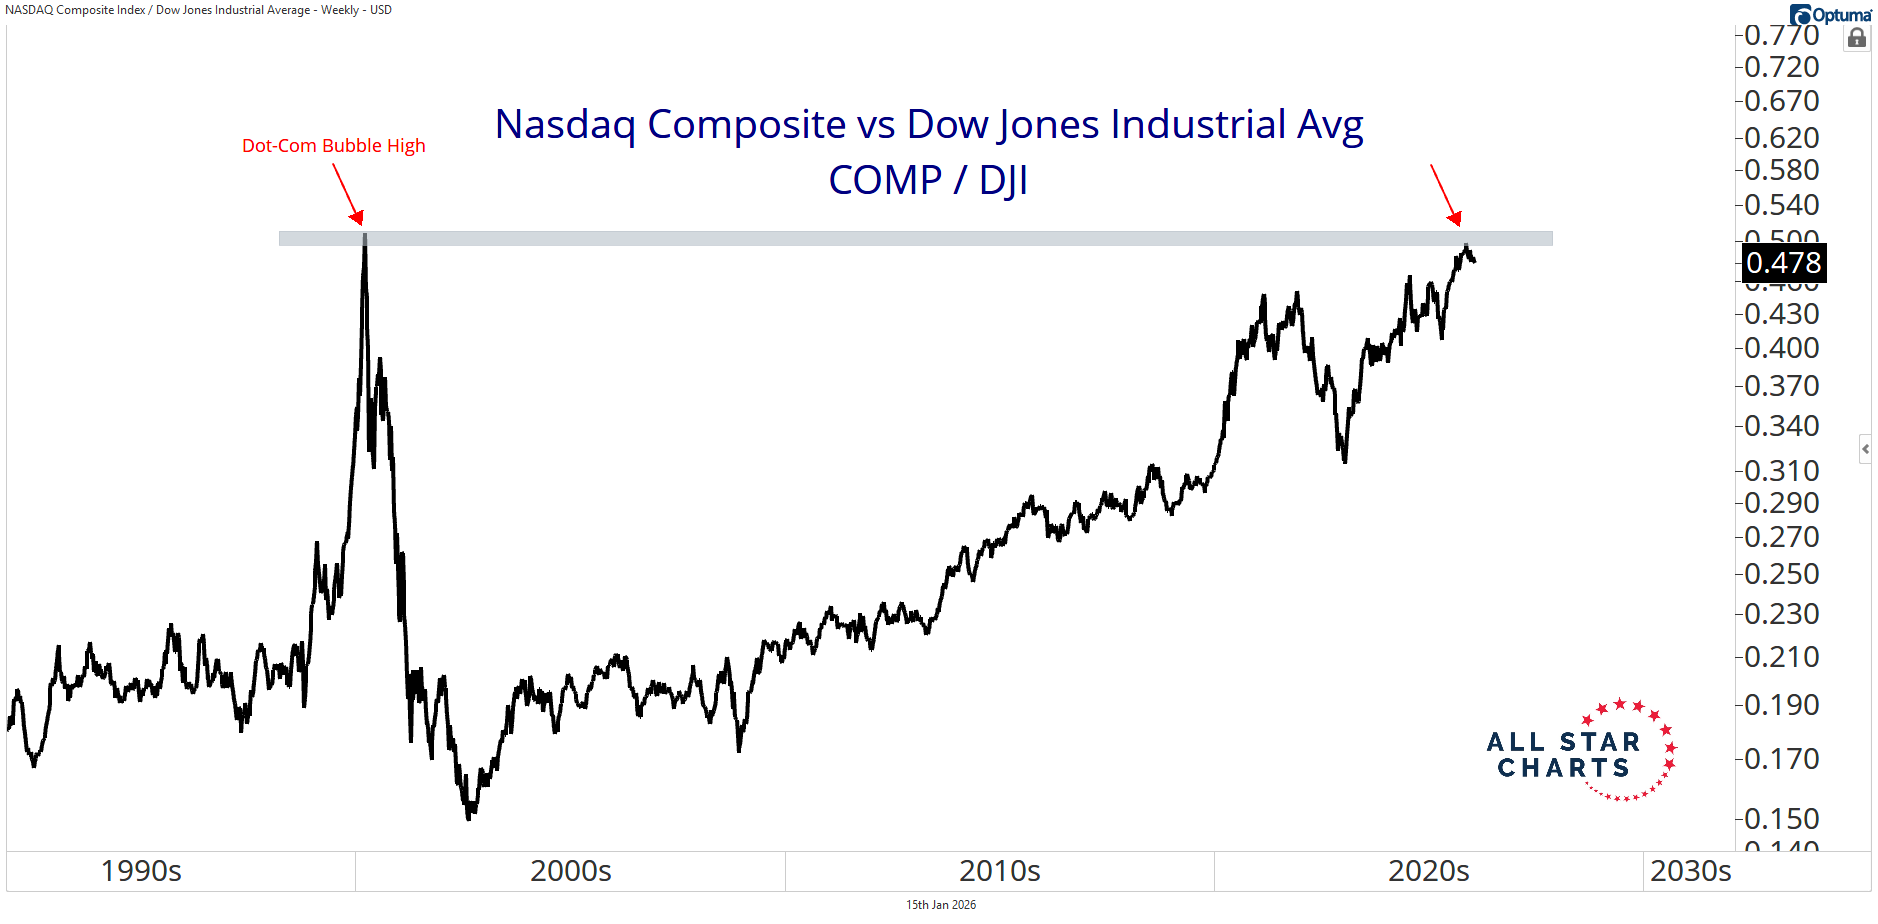
The ratio is struggling to reclaim the 161.8% extension and looks like it's settling back into its previous range. If the ratio falls below 2.21, it could signal an opportunity for value sectors to start leading, even if only temporarily. A similar story is playing out when you look at the Nasdaq Composite versus the Dow Jones Industrial Average. |
The Nasdaq is roughly 60% tech and 20% Consumer Discretionary. The Dow, on the other hand, is only 20% tech, 28% Financials, and 15% Industrials—essentially a more value-oriented index. Right now, that ratio is hitting a brick wall at its dot-com bubble high, making this area a critical inflection point. If there's a place for value to reassert some leadership, this could be it. Is this simply a near-term mean reversion, a short-term counter-trend rally… or the beginning of a major rotation into value? Let me know what you think! Alfonso De Pablos, CMT Director of Research, All Star Charts |
Q3 Earnings Are In — Here's What Mattered Earnings headlines tell you what companies reported. Price tells you what the market believed. The Beat Quarterly analyzes how every S&P 500 stocks actually reacted — showing where institutional capital is flowing and where sponsorship is fading. Download the free Beat Quarterly and join the waitlist to get next quarter's research as it happens. |
Alfonso De Pablos, CMT | Director of Research, All Star Charts |
|
|
All Star Charts emails are a financial publication of general circulation and only offers impersonal advice, not tailored to individual needs of a specific client or group. Any comments or statements made herein do not necessarily reflect those of All Star Charts or its affiliates (collectively, "All Star Charts") and do not constitute buy or sell recommendations. Unless specifically indicated, this message is not an official confirmation of any transaction. The contents of any email communications to or from All Star Charts may be monitored or reviewed at All Star Charts's discretion. All Star Charts accepts no responsibility for any loss or damage arising in any way from the use of this transmission and any attachments; it is the responsibility of the recipient to ensure that they are virus free. If you reply to this email, please note that we are a public investor and do not want any material non-public information. We do not agree to keep confidential any information you provide and do not agree to any restrictions on our trading activity, except pursuant to a written confidentiality agreement executed by All Star Charts. |
Want to change how you receive these emails? You can manage your preferences here unsubscribe.
© 2026 All Star Charts 624 Broadway, Suite 405 San Diego, CA 92101
|
All Star Charts
624 Broadway
Suite 405
San Diego, CA 92101
|
|
|
|