Tuesday, November 18, 2025 |
|
|
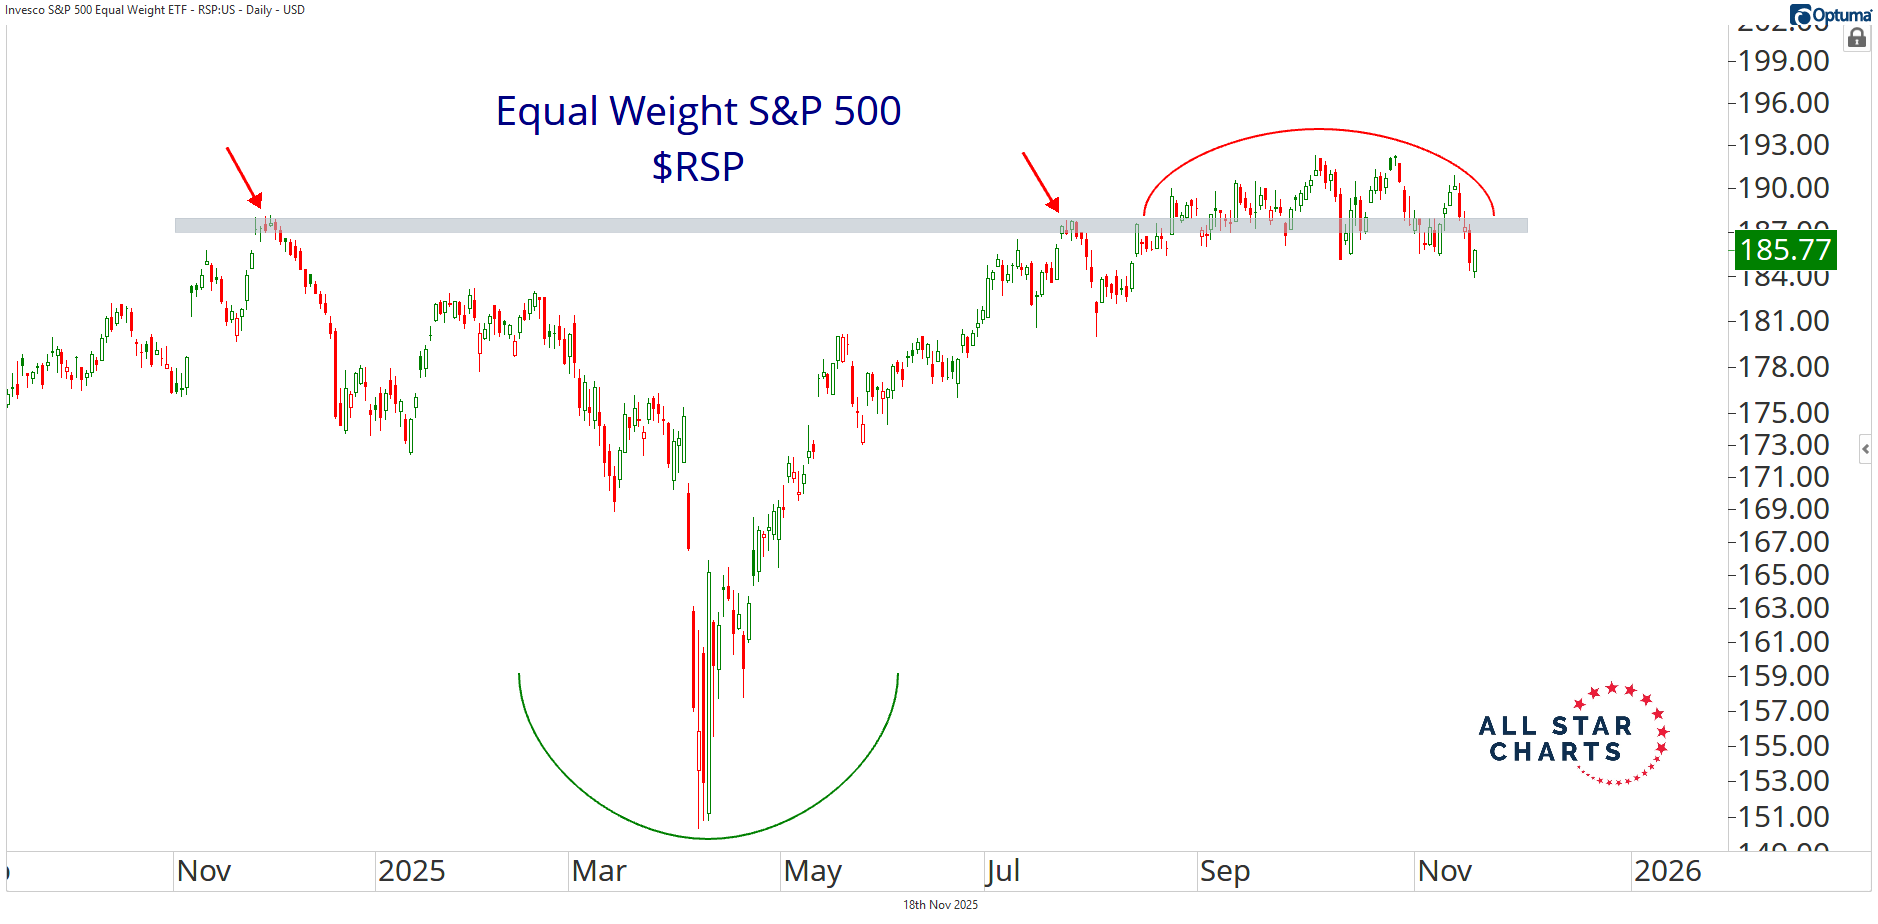
What if These Are Tops? It's been messy — a true tale of two markets. Some areas still look fine, even strong at times. But others? Not so much. And little by little, the bearish evidence keeps stacking up. Leaders are catching down to the laggards — not the other way around. Money keeps rotating out of large-cap tech, breakouts are failing, and more and more areas are losing ground — and that list just keeps growing. The good news? We have some clean, clear levels to use as a roadmap. Let's start with the Equal-Weight S&P 500 $RSP: |
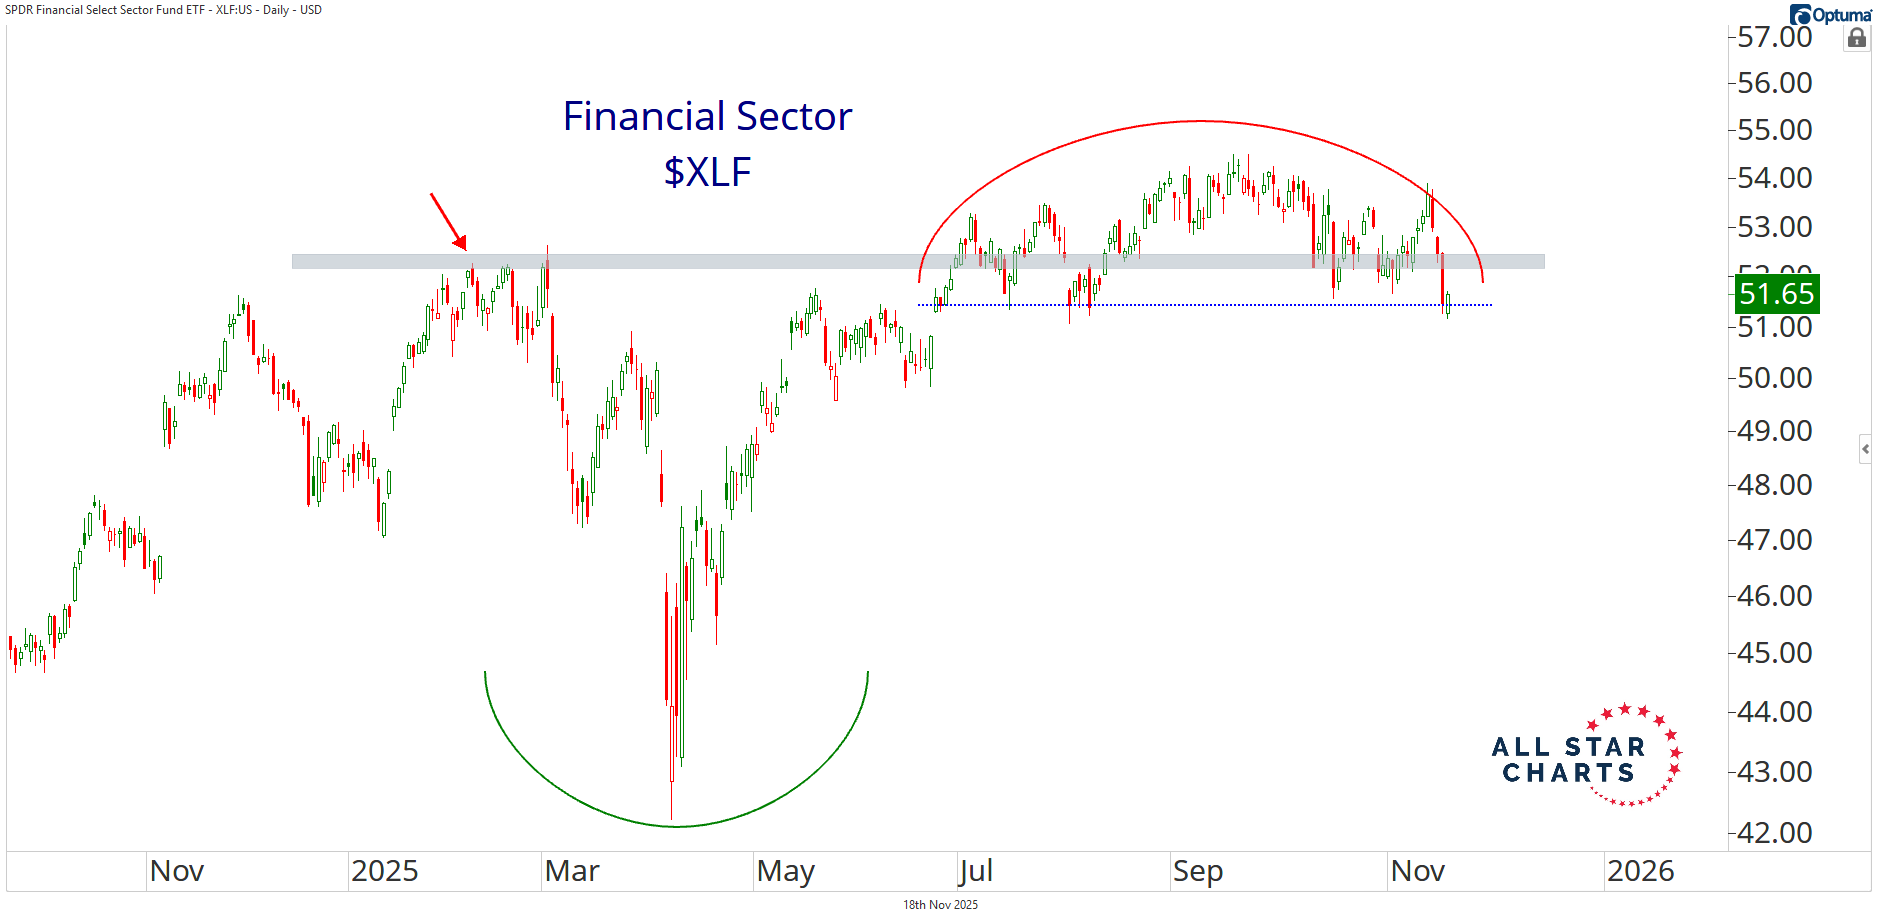
Notice how it's carved a potential short-term top right at its Q4 2024 highs. Any downside follow-through here would send a pretty clear warning to the broader market. And while RSP may only be a clue, when I think about the odds of this being a real top, a few more charts jump out right away. Financials look like they've built a similar pattern. |
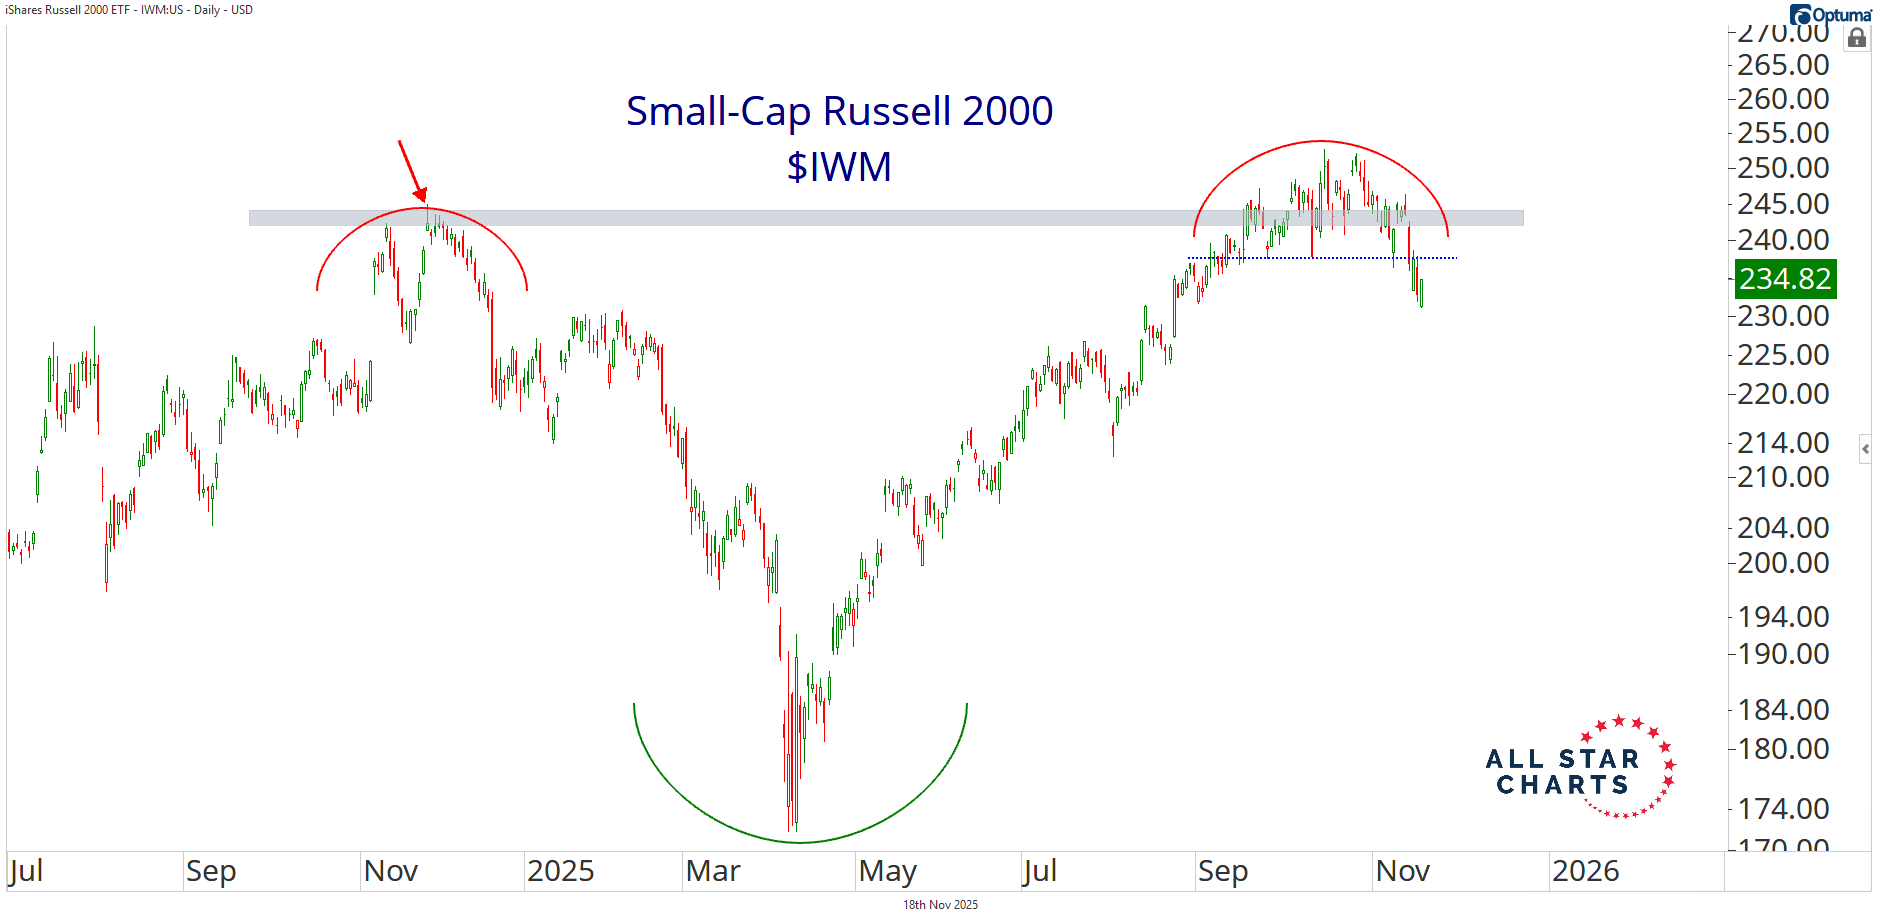
Below 51 for XLF, and we have to treat it as a top until proven otherwise. Looking down the market-cap spectrum, the Russell 2000 $IMW is tracing out the same structure as RSP. |
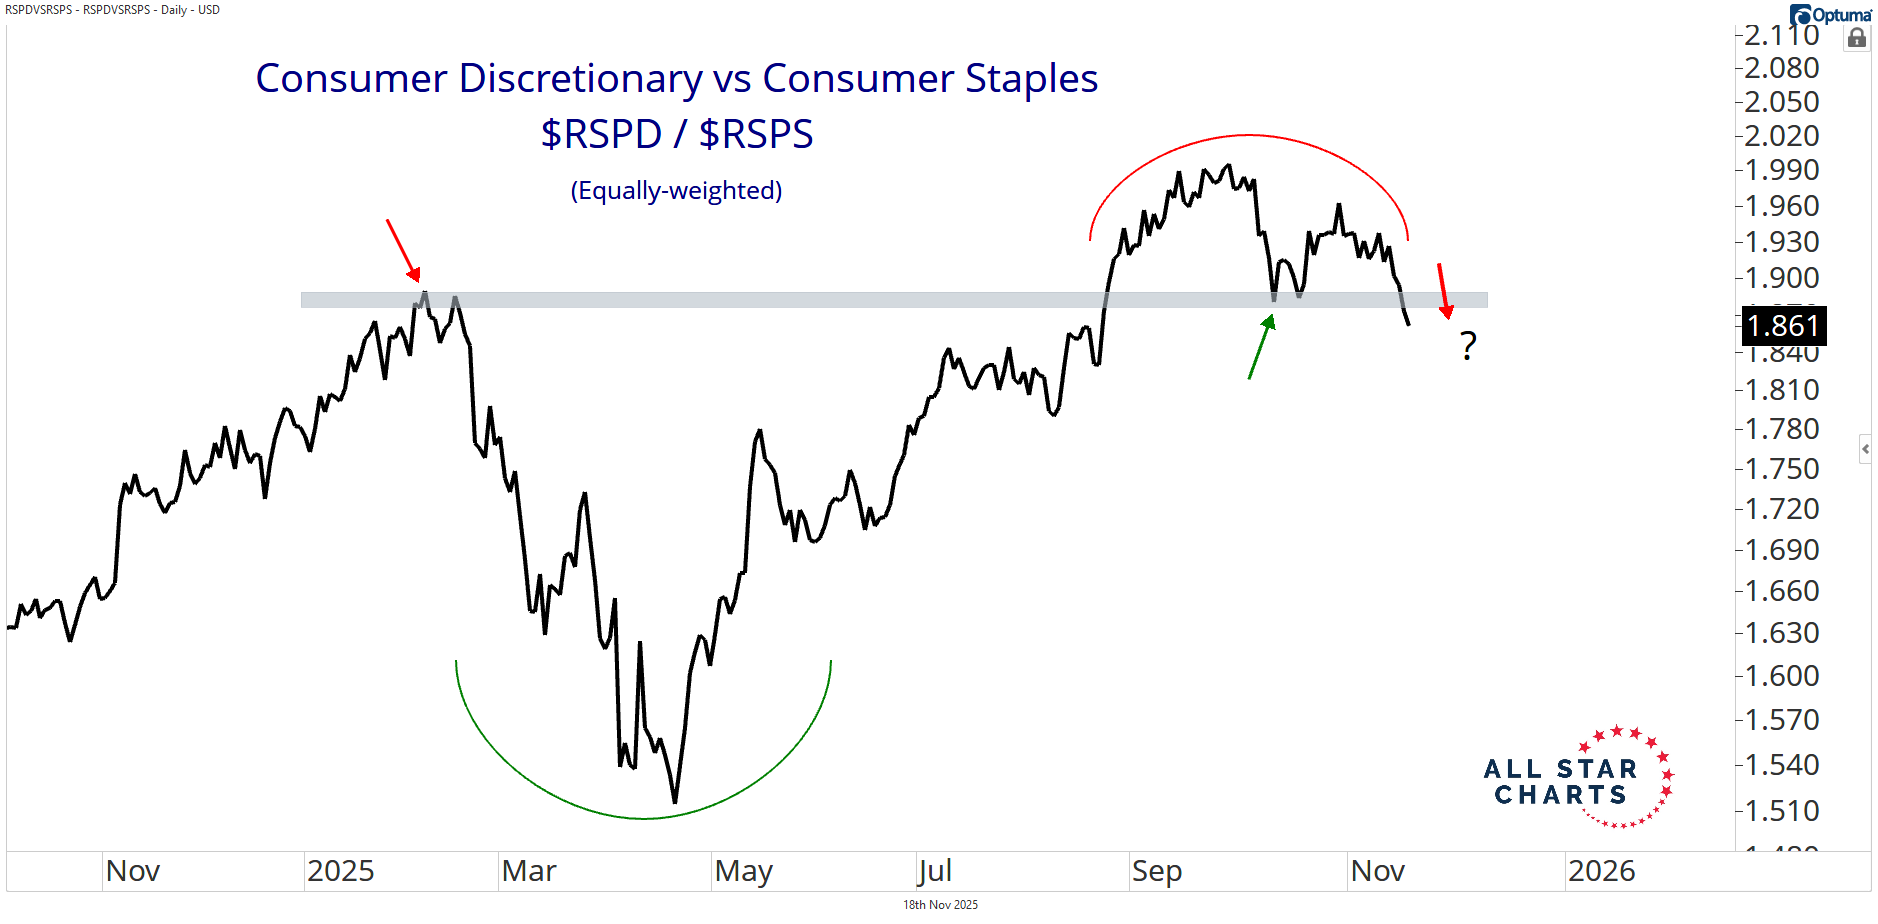
And now that price is slipping back below those prior cycle highs, that's not the type of action I want to be buying. One of the first things I learned is that owning stocks below overhead supply rarely ends well. These are the types of charts I prefer to sidestep until strength returns and we're breaking back above resistance. Meanwhile, the Consumer Discretionary vs. Consumer Staples ratio on an equally weighted basis is threatening to break support at the former highs from earlier this year: |
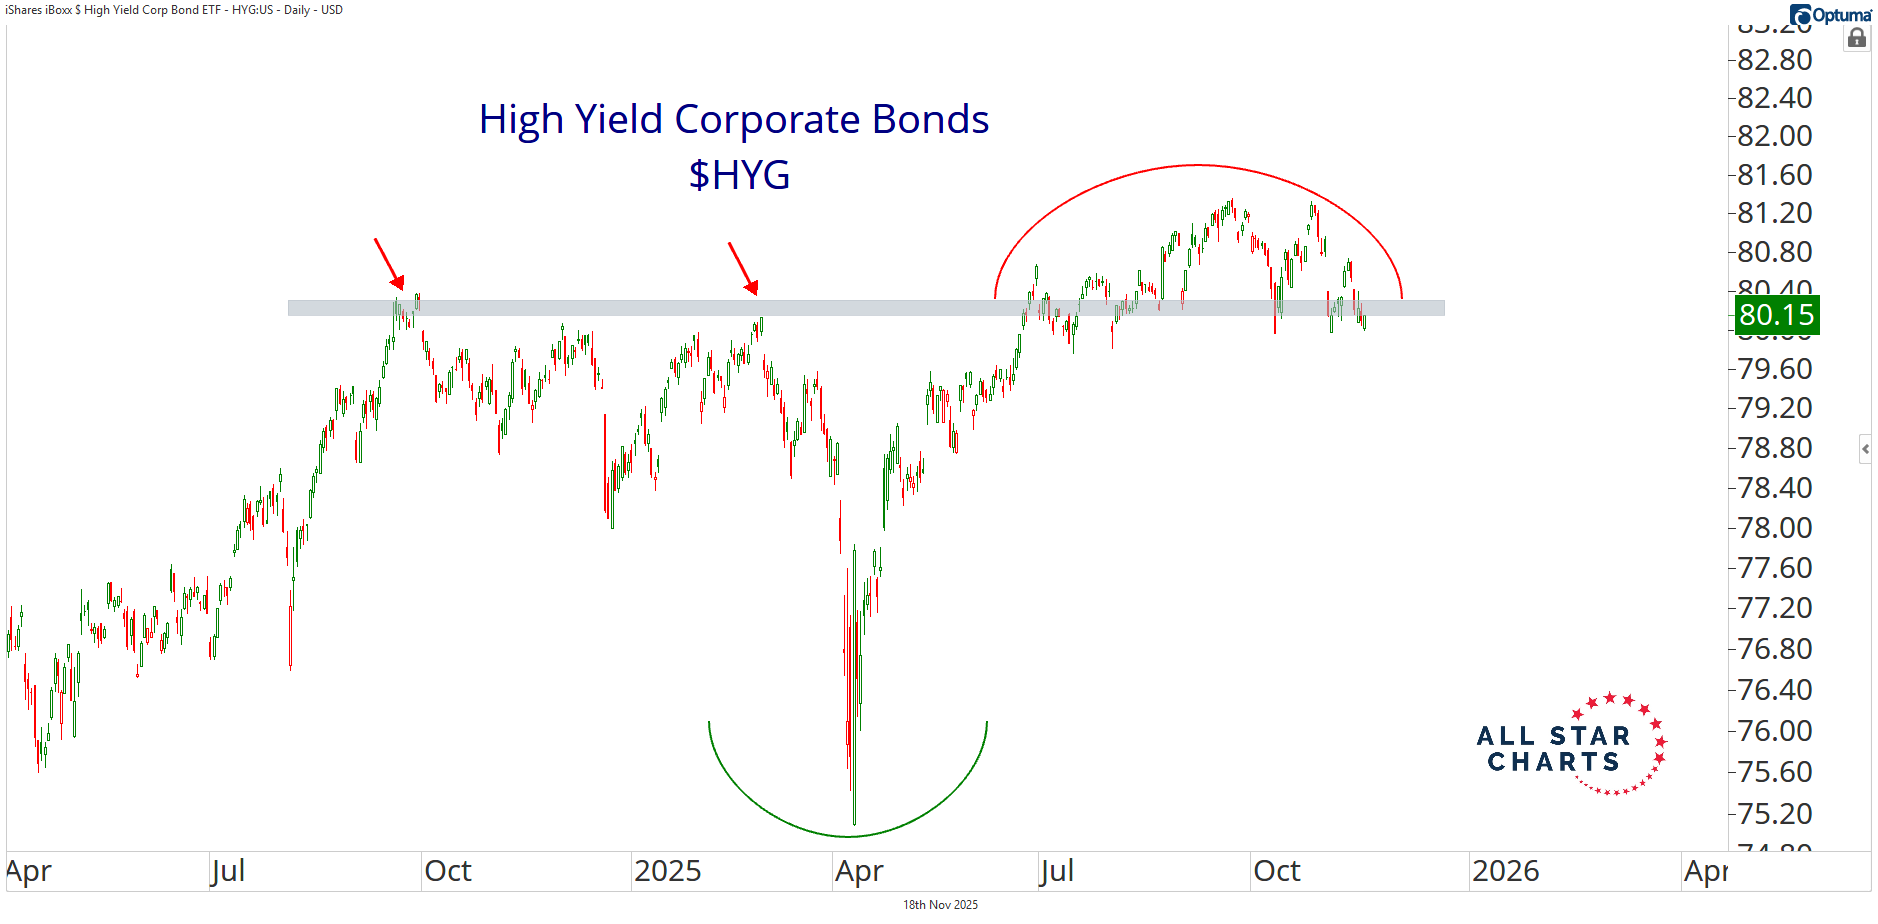
And if there's one thing we know about Staples outperforming Discretionary… …it's that it usually doesn't happen during healthy market environments. Bulls really need this level to hold — otherwise it's a clear sign that risk appetite is fading. And we can't talk about risk appetite without mentioning High-Yield Corporate Bonds $HYG: |
The line in the sand is 80 for HYG. Lose that, and credit — one of the most reliable tells for risk — confirms what equities are already hinting at. If you go chart by chart, a lot of them are starting to look the same — moving sideways and sitting right on key zones. If these levels hold, great — the bull market remains pretty intact. But if they break, it opens the door for a deeper corrective phase. Our Chief Market Strategist, Steve Strazza, will host the next ASC Premium Mid-Month Strategy Session TODAY at 8 PM ET. Make sure you join him here. Alfonso De Pablos, CMT Director of Research, All Star Charts |
Alfonso De Pablos, CMT | Director of Research, All Star Charts |
|
|
All Star Charts emails are a financial publication of general circulation and only offers impersonal advice, not tailored to individual needs of a specific client or group. Any comments or statements made herein do not necessarily reflect those of All Star Charts or its affiliates (collectively, "All Star Charts") and do not constitute buy or sell recommendations. Unless specifically indicated, this message is not an official confirmation of any transaction. The contents of any email communications to or from All Star Charts may be monitored or reviewed at All Star Charts's discretion. All Star Charts accepts no responsibility for any loss or damage arising in any way from the use of this transmission and any attachments; it is the responsibility of the recipient to ensure that they are virus free. If you reply to this email, please note that we are a public investor and do not want any material non-public information. We do not agree to keep confidential any information you provide and do not agree to any restrictions on our trading activity, except pursuant to a written confidentiality agreement executed by All Star Charts. |
Want to change how you receive these emails? You can manage your preferences here unsubscribe.
© 2025 All Star Charts 624 Broadway, Suite 405 San Diego, CA 92101
|
All Star Charts
624 Broadway
Suite 405
San Diego, CA 92101
|
|
|
|