If there's a place for commodities to kick off another big run—this is it. ͏ ͏ ͏ ͏ ͏ ͏ ͏ ͏ ͏ ͏ ͏ ͏ ͏ ͏ ͏ ͏ ͏ ͏ ͏ ͏ ͏ ͏ ͏ ͏ ͏ ͏ ͏ ͏ ͏ ͏ ͏ ͏ ͏ ͏ ͏ ͏ ͏ ͏ ͏ ͏ ͏ ͏ ͏ ͏ ͏ ͏ ͏ ͏ ͏ ͏ ͏ ͏ ͏ ͏ ͏ ͏ ͏ ͏ ͏ ͏ ͏ ͏
The Best Morning Show in Finance is back! Click here to join Steve Strazza and JC Parets LIVE today on Stock Market TV. This show is about ignoring the noise and focusing on the things that traders and investors need to know to get the week started right. We'll be LIVE @ 830AM ET. Use this link to join us and participate in the chat. |
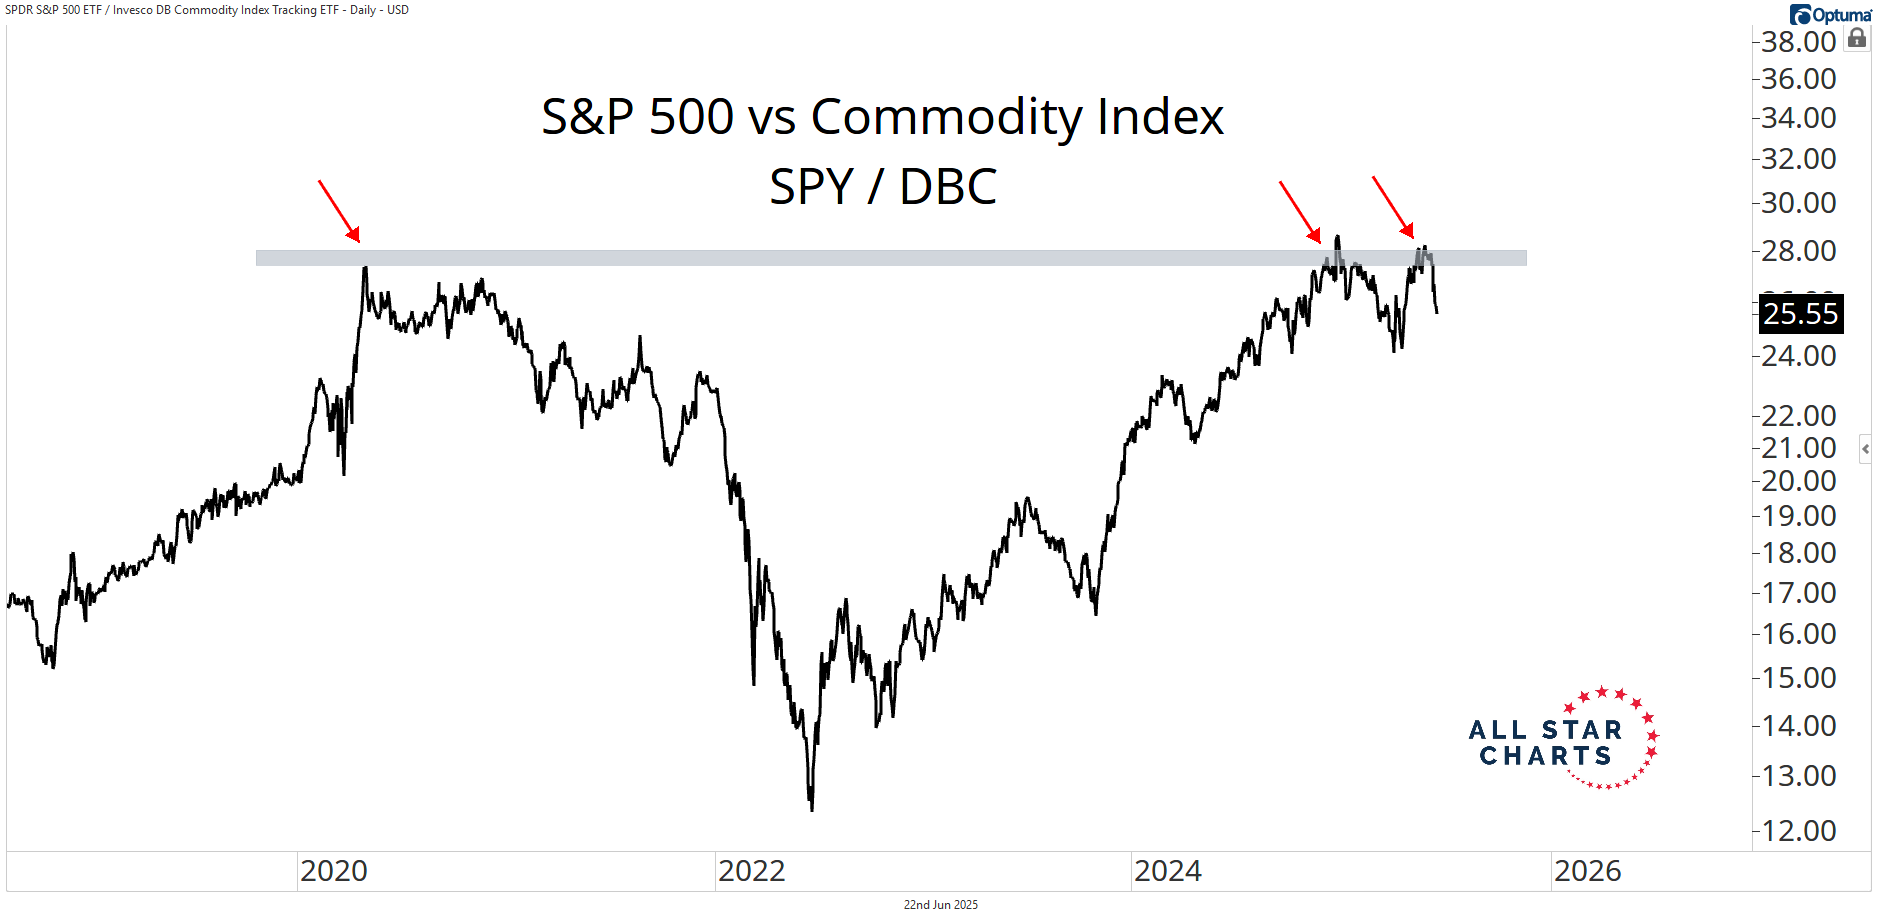
Commodities Might Be Ready On weekends like this, we're glad to be technicians. Geopolitical tensions in the Middle East. Rumors flying. Headlines all over the place. Everyone's trying to figure out what it all means. What's next? Who's in control? But we're chart guys. We're not in the business of guessing what politicians will do or how the news cycle will spin. That's not our edge. That's noise. The only thing that matters to us is price. And the charts are speaking loud and clear. Money rotates. From one asset class to another. It always has. That's the game. There are periods for equities. Periods for commodities. Even for bonds. Right now, this ratio of the S&P 500 vs the Invesco DB Commodity Index tells us something might be shifting. |
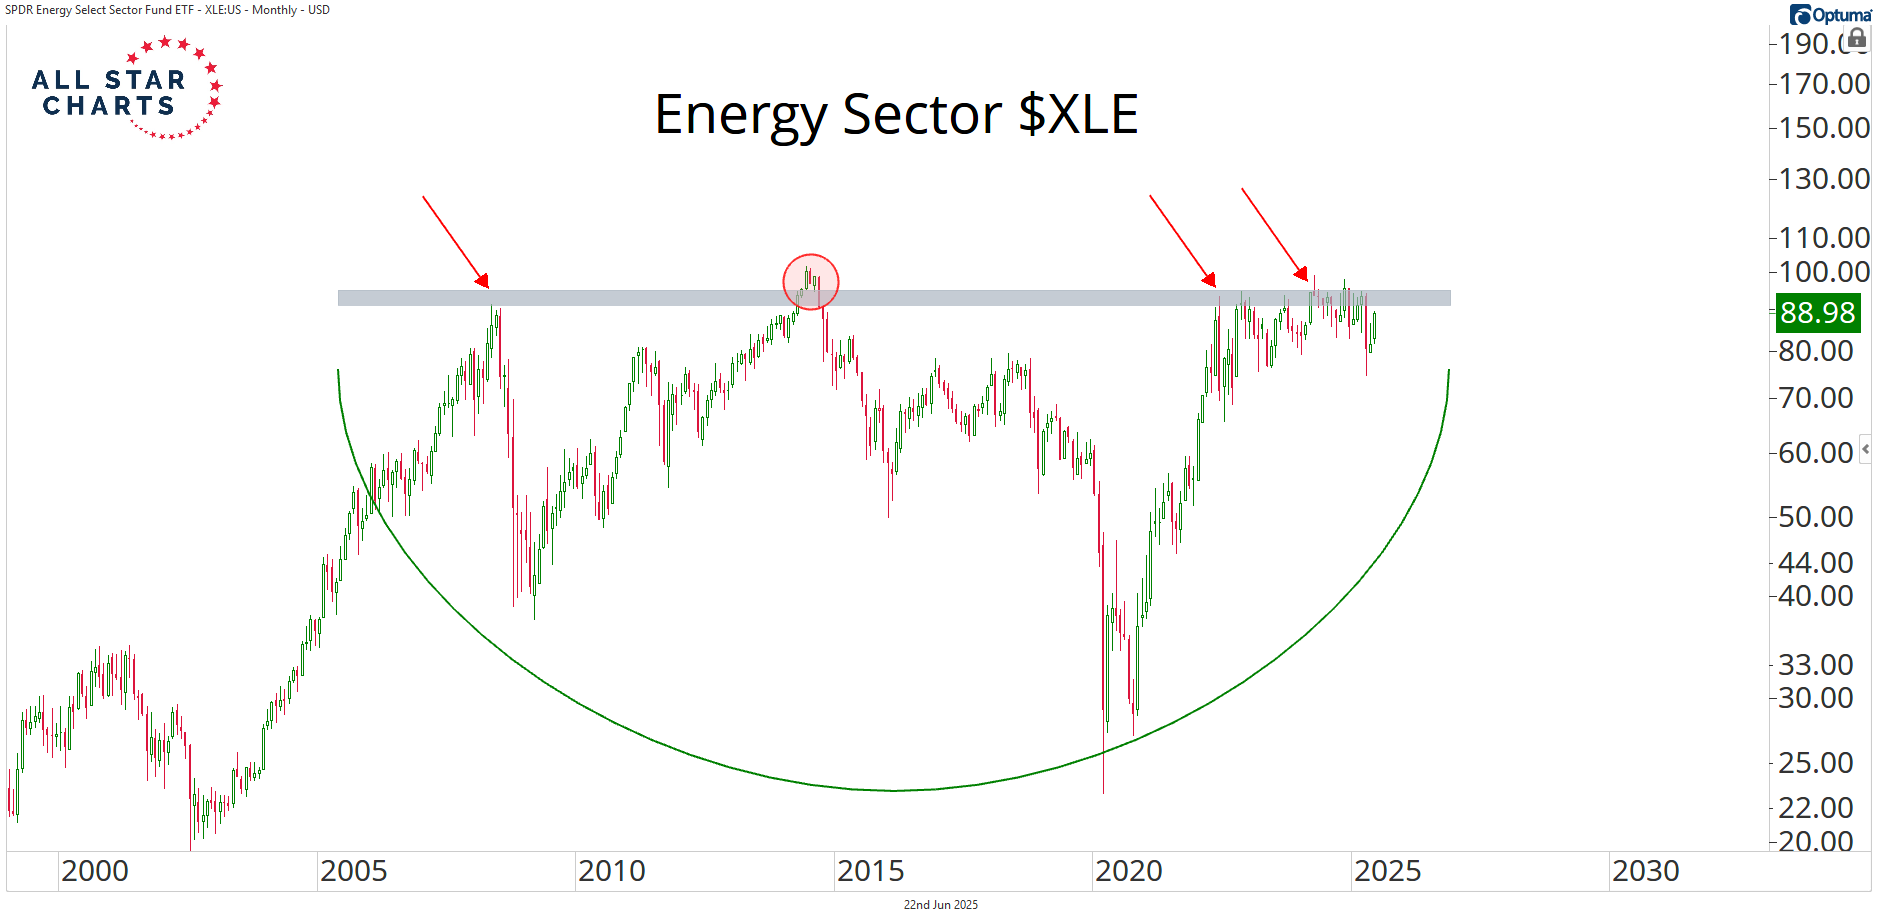
It's been quiet—but the signs are there. That ratio stalled at the same level it did in 2020. And again last December. So far this year, US equities have been lagging commodities. These trends don't reverse overnight. They build. They shake you out. They surprise. Just like five years ago—when crude went negative. Most people panicked. But that was the start of a major leg higher for commodities. If there's a place for commodities to kick off another big run—this is it. And I'm looking at Energy. The SPDR Energy Sector ETF $XLE has been pressing against the top of a massive base for years. |
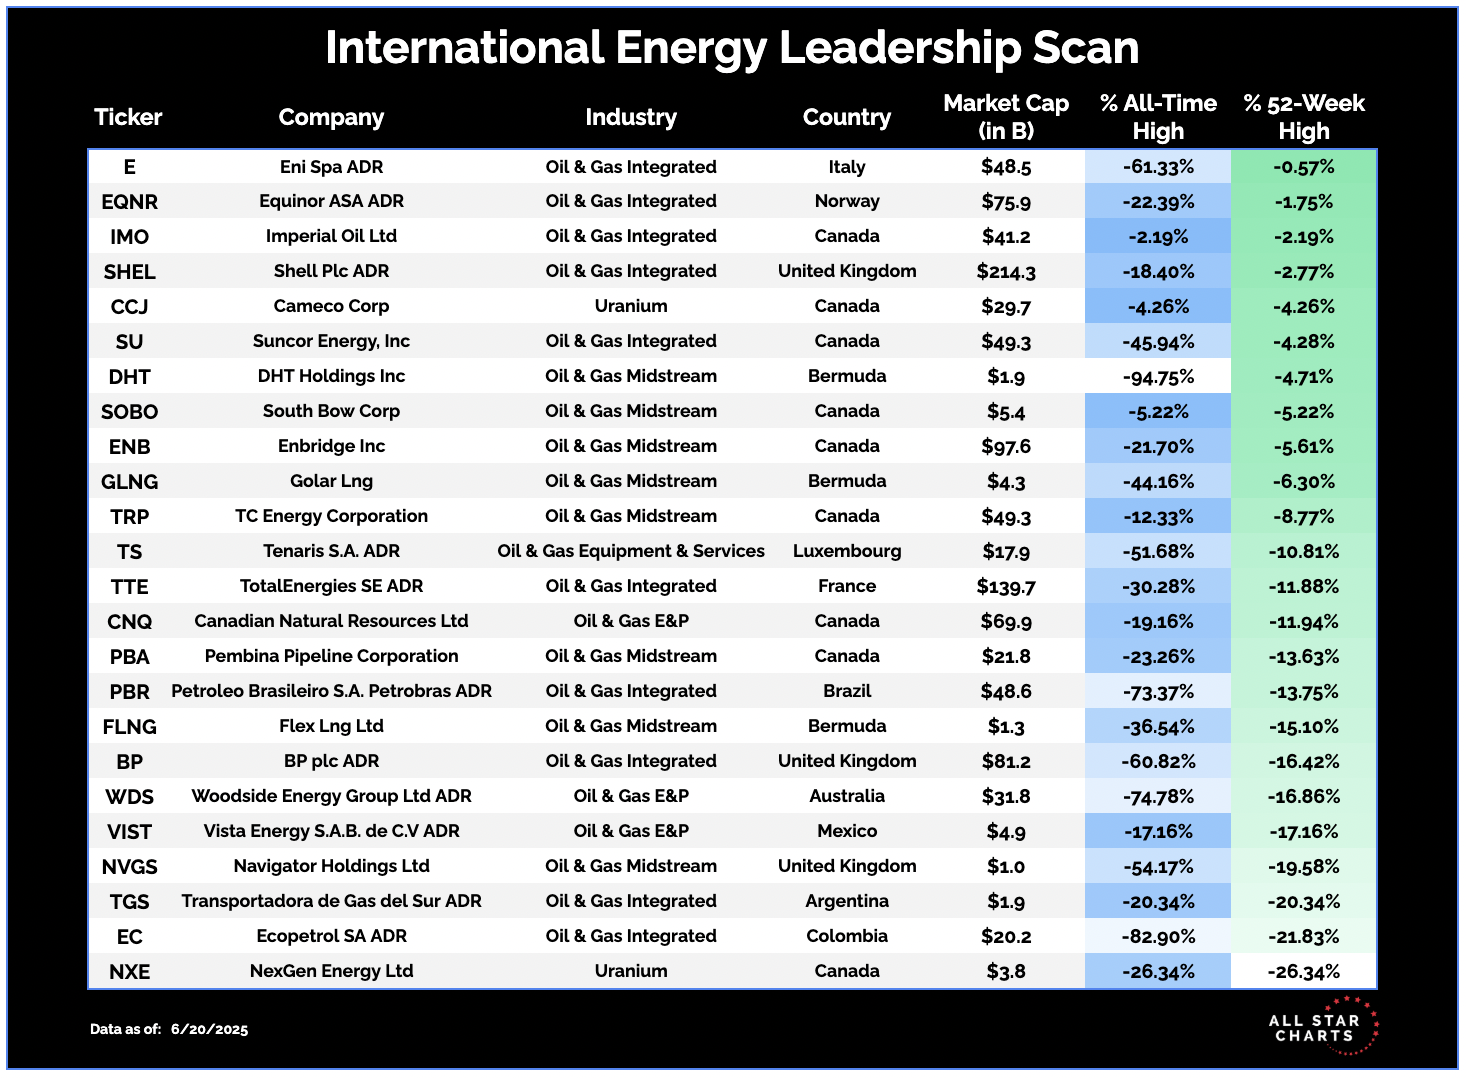
The big question is: how long will it take for buyers to finally absorb all that overhead supply? That SPY/DBC ratio might be the tell. Here are some of the best-looking energy stocks outside of the US. |
Multiplying Returns on Breakouts Strazza's been pounding the table in this theme lately. He just nailed a 900% return on his $CRK calls that expired last Friday—and he's still sitting on a 500% gain in the $CRK July 18th calls. Just look at this trade from a few weeks ago. Clean setup. Explosive follow-through. As a reminder, Steve takes the very best of ASC Research and executes with leverage in the open market using the Proprietary Breakout Multiplier Strategy. If you want to follow along and catch the next one, join him at Breakout Multiplier—risk free. 👉 Click here to join now. |
|
|
All Star Charts emails are a financial publication of general circulation and only offers impersonal advice, not tailored to individual needs of a specific client or group. Any comments or statements made herein do not necessarily reflect those of All Star Charts or its affiliates (collectively, "All Star Charts") and do not constitute buy or sell recommendations. Unless specifically indicated, this message is not an official confirmation of any transaction. The contents of any email communications to or from All Star Charts may be monitored or reviewed at All Star Charts's discretion. All Star Charts accepts no responsibility for any loss or damage arising in any way from the use of this transmission and any attachments; it is the responsibility of the recipient to ensure that they are virus free. If you reply to this email, please note that we are a public investor and do not want any material non-public information. We do not agree to keep confidential any information you provide and do not agree to any restrictions on our trading activity, except pursuant to a written confidentiality agreement executed by All Star Charts. |
Want to change how you receive these emails? You can manage your preferences here unsubscribe . © 2025 All Star Charts |
|
|
|